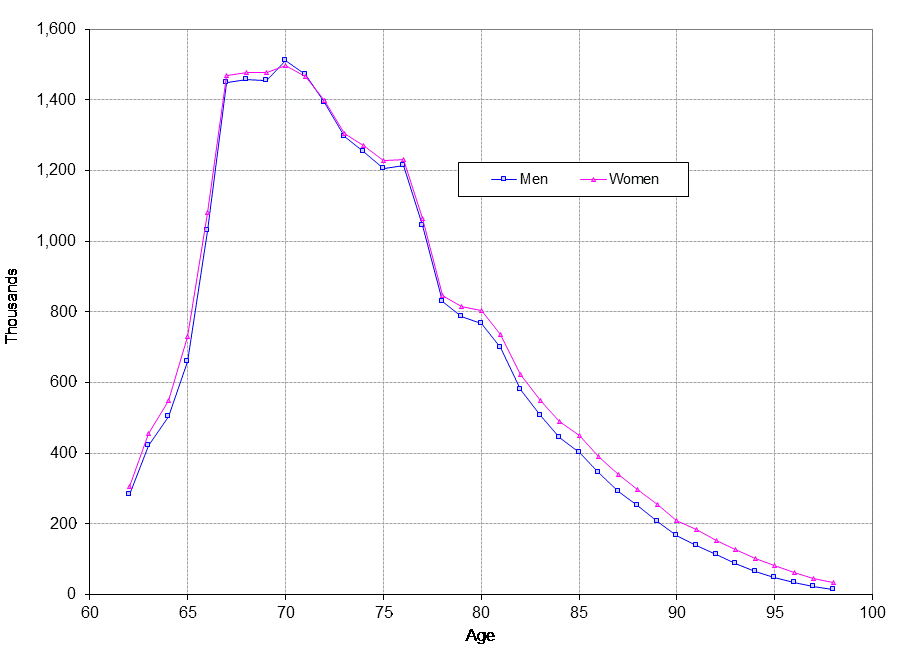
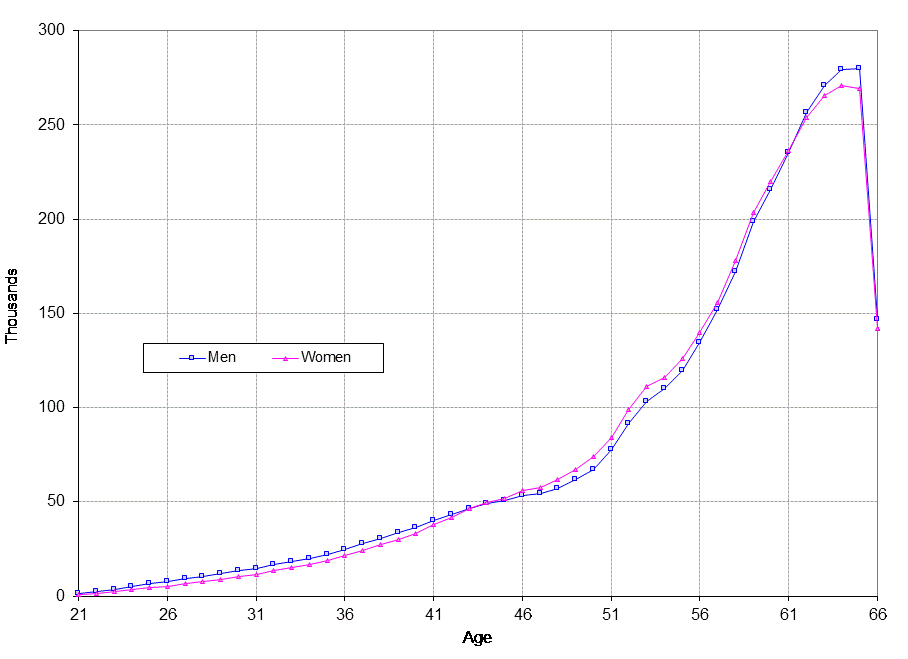
The graphs below shows the number of Social Security beneficiaries who are receiving Social Security benefits on the basis of their earnings, as of June 30, 2024. We call such people "primary" beneficiaries. The two types of primary beneficiaries are retired workers and disabled workers. The graphs display the number of primary beneficiaries by age and sex. Clicking on a graph will reveal the data used to make the graph.
The graph at right shows the number of retired workers from the ages of 62 (the earliest retirement age) to age 98. Although there are retired workers who are older than age 98, we do not display that because the lines for men and women gradually merge with the horizontal age axis after age 98.
The graph at right shows the number of disabled workers from the ages of 21 to 66. Note that some disabled workers choose to receive retirement benefits after they reach age 62, and such beneficiaries are not included in this graph. This is the reason for the pattern at ages 62 and older. Also note that the Normal Retirement Age (NRA) is gradually increasing to age 67 for those born in 1954 and later. Beginning in January 2021, there are a small number of disabled workers at age 66, and this number will increase over the the next few years as NRA continues to increase.

