SSI Disabled Recipients Who Work, December 2003
Blind and Disabled Recipients Who Work
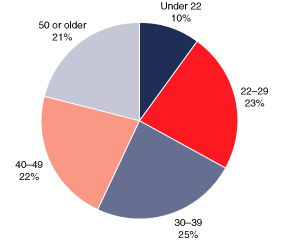
One-third of the working recipients in December 2003 were under age 30, and 25 percent were aged 30–39. Only 21 percent were aged 50 or older.

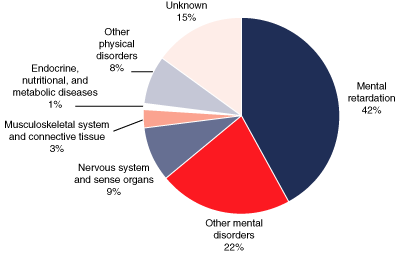
A large majority of working SSI recipients aged 18–64 in December 2003 were disabled because of a mental impairment. Forty-two percent were diagnosed with mental retardation and 22 percent with other mental disorders. Nine percent had diseases of the nervous system and sense organs, mostly blindness.

| Diagnostic group | Percent |
|---|---|
| Mental retardation | 42 |
| Other mental disorders | 22 |
| Nervous system and sense organs | 9 |
| Musculoskeletal system and connective tissue | 3 |
| Endocrine, nutritional, and metabolic diseases | 1 |
| Other physical disorders | 8 |
| Unknown | 15 |
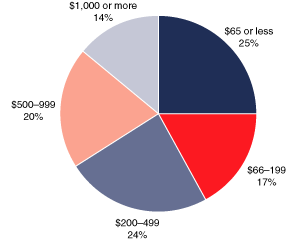
Two out of three working recipients earned less than $500 in December 2003. This amount would not affect their status as disabled, since it is less than the substantial gainful activity level of $800 for 2003. One out of seven earned $1,000 or more. This proportion includes those receiving special cash benefits, or special Medicaid status, under section 1619.

| State or area | Total | Section 1619(a) participants |
Section 1619(b) participants |
Other recipients who work |
|---|---|---|---|---|
| All areas a | 323,682 | 17,130 | 71,089 | 235,447 |
| Alabama | 3,714 | 219 | 902 | 2,593 |
| Alaska | 574 | 29 | 154 | 391 |
| Arizona | 3,423 | 209 | 879 | 2,335 |
| Arkansas | 3,405 | 149 | 739 | 2,517 |
| California | 42,178 | 3,568 | 6,497 | 32,113 |
| Colorado | 3,931 | 143 | 807 | 2,981 |
| Connecticut | 3,842 | 166 | 1,058 | 2,618 |
| Delaware | 804 | 36 | 242 | 526 |
| District of Columbia | 663 | 57 | 219 | 387 |
| Florida | 11,080 | 690 | 3,174 | 7,216 |
| Georgia | 6,990 | 319 | 1,454 | 5,217 |
| Hawaii | 746 | 41 | 150 | 555 |
| Idaho | 1,674 | 69 | 423 | 1,182 |
| Illinois | 12,999 | 738 | 2,711 | 9,550 |
| Indiana | 5,713 | 244 | 1,427 | 4,042 |
| Iowa | 6,567 | 197 | 1,487 | 4,883 |
| Kansas | 3,920 | 142 | 935 | 2,843 |
| Kentucky | 4,593 | 210 | 1,125 | 3,258 |
| Louisiana | 5,454 | 375 | 1,424 | 3,655 |
| Maine | 2,206 | 100 | 643 | 1,463 |
| Maryland | 5,602 | 274 | 1,219 | 4,109 |
| Massachusetts | 9,671 | 618 | 2,876 | 6,177 |
| Michigan | 13,947 | 598 | 3,143 | 10,206 |
| Minnesota | 9,222 | 278 | 2,044 | 6,900 |
| Mississippi | 3,054 | 203 | 783 | 2,068 |
| Missouri | 7,163 | 263 | 1,709 | 5,191 |
| Montana | 1,694 | 50 | 373 | 1,271 |
| Nebraska | 2,934 | 98 | 587 | 2,249 |
| Nevada | 1,329 | 66 | 302 | 961 |
| New Hampshire | 1,248 | 50 | 330 | 868 |
| New Jersey | 7,605 | 327 | 1,694 | 5,584 |
| New Mexico | 2,142 | 105 | 586 | 1,451 |
| New York | 29,742 | 1,665 | 5,979 | 22,098 |
| North Carolina | 7,674 | 284 | 1,576 | 5,814 |
| North Dakota | 1,332 | 26 | 286 | 1,020 |
| Ohio | 16,582 | 722 | 3,058 | 12,802 |
| Oklahoma | 3,579 | 139 | 566 | 2,874 |
| Oregon | 3,826 | 123 | 919 | 2,784 |
| Pennsylvania | 15,481 | 914 | 3,623 | 10,944 |
| Rhode Island | 1,668 | 85 | 368 | 1,215 |
| South Carolina | 4,786 | 162 | 831 | 3,793 |
| South Dakota | 2,089 | 54 | 472 | 1,563 |
| Tennessee | 5,242 | 255 | 1,177 | 3,810 |
| Texas | 13,594 | 713 | 3,302 | 9,579 |
| Utah | 2,112 | 81 | 422 | 1,609 |
| Vermont | 1,071 | 52 | 351 | 668 |
| Virginia | 6,260 | 315 | 1,441 | 4,504 |
| Washington | 5,594 | 407 | 1,627 | 3,560 |
| West Virginia | 1,976 | 124 | 454 | 1,398 |
| Wisconsin | 10,211 | 349 | 2,360 | 7,502 |
| Wyoming | 760 | 29 | 181 | 550 |
| Outlying area | ||||
| Northern Mariana Islands | 16 | b | b | b |
| SOURCE: Social Security Administration, Supplemental Security Record (Characteristic Extract Record format), 100 percent data. | ||||
| a. Includes data not distributed by category. | ||||
| b. Data are not shown to avoid disclosure of information for particular individuals. | ||||
| CONTACT: Clark Pickett (410) 965-9016 or ssi.workers@ssa.gov. | ||||
| Characteristic | Number | Percent | Average earnings (dollars) |
|---|---|---|---|
| Total | 323,682 | 100.0 | 469 |
| Age | |||
| Under 18 | 3,194 | 1.0 | 382 |
| 18–21 | 29,137 | 9.0 | 436 |
| 22–29 | 72,943 | 22.5 | 529 |
| 30–39 | 80,117 | 24.8 | 497 |
| 40–49 | 71,128 | 22.0 | 471 |
| 50–59 | 42,504 | 13.1 | 421 |
| 60–64 | 12,518 | 3.9 | 366 |
| 65 or older | 12,141 | 3.8 | 280 |
| Sex | |||
| Male | 171,840 | 53.1 | 468 |
| Female | 151,842 | 46.9 | 469 |
| Earned income a | |||
| Wages | 306,073 | 94.6 | 482 |
| Self-employment | 18,812 | 5.8 | 281 |
| Earnings (dollars) | |||
| 65 or less | 80,874 | 25.0 | 52 |
| 66–99 | 15,037 | 4.6 | 82 |
| 100–199 | 40,792 | 12.6 | 137 |
| 200–299 | 31,774 | 9.8 | 234 |
| 300–399 | 25,386 | 7.8 | 333 |
| 400–499 | 21,156 | 6.5 | 432 |
| 500–599 | 19,849 | 6.1 | 527 |
| 600–699 | 15,843 | 4.9 | 630 |
| 700–799 | 11,769 | 3.6 | 734 |
| 800–899 | 9,322 | 2.9 | 829 |
| 900–999 | 6,900 | 2.1 | 931 |
| 1,000 or more | 44,980 | 13.9 | 1,611 |
| Unearned income a | |||
| None | 161,282 | 49.8 | 548 |
| Social Security | 141,139 | 43.6 | 367 |
| Other pensions | 2,623 | 0.8 | 303 |
| Income based on need | 90 | 0 | 713 |
| Asset income | 23,254 | 7.2 | 421 |
| Other | 12,262 | 3.8 | 559 |
| Work incentives a | |||
| Section 1619(a) | 17,132 | 5.3 | 1,059 |
| Section 1619(b) | 71,097 | 22.0 | 1,081 |
| Plans for achieving self-support b | 438 | 0.1 | 720 |
| Impairment-related work expenses | 7,604 | 2.3 | 521 |
| Blind work expenses | 3,074 | 0.9 | 945 |
| SOURCE: Social Security Administration, Supplemental Security Record (Characteristic Extract Record format), 100 percent data. | |||
| NOTE: Includes section 1619(b) participants. | |||
| a. The sum of the entries may be greater than the total because some recipients may receive more than one type of earned or unearned income, or both earned and unearned income, or benefit from more than one work incentive provision. | |||
| b. Number of working recipients with a plan for achieving self-support (PASS). See Tables 14–17 for data on all recipients with a PASS. | |||
| CONTACT: Clark Pickett (410) 965-9016 or ssi.workers@ssa.gov. | |||