Who Never Receives Social Security Benefits?
Social Security Bulletin, Vol. 71, No. 2, 2011 (released May 2011)
We estimate that about 4 percent of individuals aged 62–84 in 2010 will never receive Social Security benefits. This article describes the prevalence, demographic characteristics, and economic well-being of this group. The never-beneficiary population generally has lower education levels and higher proportions of women, Hispanics, immigrants, the never-married, and widows than the beneficiary population. Never-beneficiaries have a far higher poverty rate (about 44 percent) than current and future beneficiaries (about 4 percent). Ninety-five percent of never-beneficiaries are individuals whose earnings histories are insufficient to qualify for benefits. Late-arriving immigrants and infrequent workers comprise the vast majority of these insufficient earners. Late-arriving immigrants have a poverty rate of about 43 percent, and are particularly reliant on income from household coresidents. Infrequent workers have a poverty rate of about 57 percent, and are particularly reliant on Supplemental Security Income.
The authors are with the Office of Retirement Policy, Office of Retirement and Disability Policy, Social Security Administration.
Acknowledgments: The authors thank Lynn Fisher, Joyce Nicholas, Anya Olsen, Kathleen Romig, Mark Sarney, Alexander Strand, and David Weaver for their assistance, comments, and suggestions.
Contents of this publication are not copyrighted; any items may be reprinted, but citation of the Social Security Bulletin as the source is requested. The findings and conclusions presented in the Bulletin are those of the authors and do not necessarily represent the views of the Social Security Administration.
Summary
| MINT | Modeling Income in the Near Term |
| QC | Quarter of coverage |
| SSI | Supplemental Security Income |
Social Security is often perceived as a universal program for the aged because of its wide reach. As of 2010, 85.6 percent of persons aged 65 or older were receiving income from Social Security, far surpassing the percentage receiving income from any other source.1 However, some aged individuals never receive Social Security Old-Age, Survivors, and Disability Insurance (OASDI) benefits. This article examines the prevalence, demographic characteristics, and economic well-being of these never-beneficiaries.
Few studies have specifically addressed never-beneficiaries, but the characteristics of this group are worth examining, particularly for policymakers and theorists concerned with the overall well-being of the aged. Proposals to reduce elderly poverty through a Social Security minimum benefit or other options targeting low-earning Social Security beneficiaries may be less effective than anticipated if never-beneficiaries remain ineligible for Social Security and beyond the reach of these initiatives.
We analyze never-beneficiaries using projections from the Modeling Income in the Near Term (MINT) microsimulation model, focusing on individuals aged 62 to 84 in 2010.2 One advantage of the MINT model is that it includes projections of beneficiary status after 2010, and allows us to project whether individuals aged 62 to 84 in 2010 will remain nonbeneficiaries for the rest of their lives. The major findings, briefly summarized here, are discussed in detail below:
- About 4 percent of the aged population never receives Social Security benefits. These never-beneficiaries include higher proportions of women, Hispanics, immigrants, the never-married, and the widowed than the beneficiary population; never-beneficiaries are also comparatively less educated.
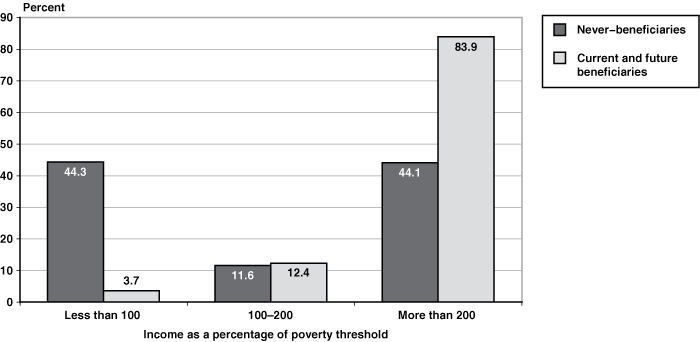
- The never-beneficiary poverty rate is 44.3 percent, far higher than the 3.7 percent poverty rate among beneficiaries.
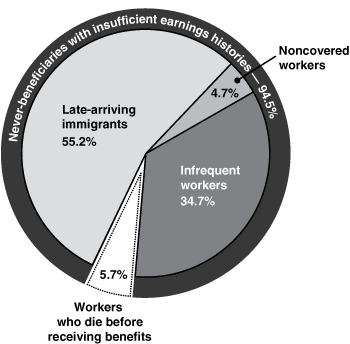
- Almost 95 percent of never-beneficiaries have insufficient work histories to gain Social Security coverage. Within this group we identify three mutually exclusive categories: late-arriving immigrants (55.1 percent), infrequent workers (34.7 percent), and noncovered workers, of whom most are state and local government employees (4.7 percent).
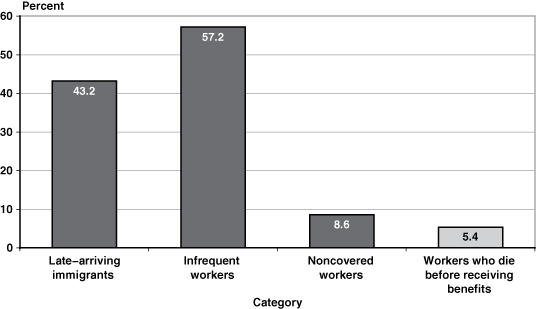
- The high poverty rate among never-beneficiaries is driven by late-arriving immigrants and infrequent workers, who have poverty rates of 43.2 percent and 57.2 percent, respectively. Noncovered workers have a poverty rate of 8.6 percent.
- As indicated by their high poverty rate, late-arriving immigrants and infrequent workers have little income from non–Social Security sources. Infrequent workers are more likely to receive Supplemental Security Income (SSI) than other groups, while late-arriving immigrants are more reliant on coresident income.
Never-Beneficiary Demographic and Poverty Characteristics
Nearly 4 percent of the population aged 62–84 in 2010—about 1.6 million people—is projected to never receive Social Security benefits, as shown in Table 1.3 The rest of the aged population is projected either to receive Social Security benefits in 2010 (current beneficiaries) or at some later point (future beneficiaries). Aged future beneficiaries do not receive Social Security benefits in 2010 because they either are not yet eligible for benefits, are eligible but have not yet claimed benefits, or have had their claimed benefits withheld because their earnings exceed the earnings-test exempt amount.
| Beneficiary category | Number | Percentage distribution |
|---|---|---|
| Current beneficiaries | 36,451,241 | 85.9 |
| Future beneficiaries | 4,405,826 | 10.4 |
| Never-beneficiaries | 1,581,556 | 3.7 |
| Total | 42,438,623 | 100.0 |
| SOURCE: Authors' calculations using Social Security Administration's MINT model. | ||
Table 2 shows the sex, race, marital status, immigration status, and education level of never-beneficiaries compared with all others aged 62–84 in 2010. Never-beneficiaries are more likely to be women, Hispanic, never-married, widowed, immigrants, and less educated than other aged persons in 2010. It is particularly notable that two-thirds of never-beneficiaries are women, two-thirds are immigrants, and nearly half have less than a high-school education.
| Characteristic | Never-beneficiaries | Current and future beneficiaries |
|---|---|---|
| Sex | ||
| Men | 32.8 | 46.1 |
| Women | 67.2 | 53.9 |
| Race | ||
| White | 59.2 | 87.5 |
| Black | 10.0 | 8.6 |
| Hispanic | 30.0 | 3.3 |
| Other | 0.8 | 0.6 |
| Marital Status | ||
| Never married | 15.4 | 3.7 |
| Married | 42.9 | 63.3 |
| Widowed | 31.0 | 18.6 |
| Divorced | 10.7 | 14.4 |
| Immigrant | ||
| Yes | 67.3 | 10.7 |
| No | 32.7 | 89.4 |
| Education | ||
| Less than high school | 47.6 | 15.3 |
| High school | 33.5 | 45.6 |
| Some college | 5.9 | 13.9 |
| College degree | 6.5 | 11.9 |
| Graduate degree | 6.5 | 13.3 |
| SOURCE: Authors' calculations for individuals aged 62–84 in 2010 using Social Security Administration's MINT model. | ||
| NOTE: Distributions do not necessarily sum to 100 because of rounding. | ||
Given that Social Security benefits are a critical factor in reducing elderly poverty, it is worth examining the implications of never receiving benefits on aged economic well-being.4 Over half of never-beneficiaries are either poor or "near poor" (that is, with income between 100 percent and 200 percent of the poverty threshold), compared with about one-sixth of current and future beneficiaries (Chart 1). However, the incidence of poverty varies among categories of never-beneficiaries.5
Percentage distribution of individuals aged 62–84 by income relative to poverty threshold, by beneficiary status

| Beneficiary status | Income as a percentage of poverty threshold | ||
|---|---|---|---|
| Less than 100 | 100–200 | More than 200 | |
| Never-beneficiaries | 44.3 | 11.6 | 44.1 |
| Current and future beneficiaries | 3.7 | 12.4 | 83.9 |
Categories of Never-Beneficiaries
To qualify for Social Security retirement benefits, a worker must accumulate 40 quarters of coverage (QCs). A QC is credited for a given dollar amount of earnings in covered occupations, rather than for a number of months worked. Nevertheless, accumulating 40 QCs requires at least 10 years because no more than 4 QCs can be credited in any year. The number of QCs required for disability benefits is prorated according to age at disability onset.6 Almost all (94.5 percent) of the never-beneficiaries aged 62–84 in 2010, for one reason or another, have not satisfied these requirements and thus do not receive benefits in 2010 (Chart 2).7 The remaining proportion of aged never-beneficiaries comprises individuals who are projected to be eligible for Social Security benefits, but die before receiving them.8
Percentage distribution of never-beneficiaries, by reason for nonreceipt

We divide never-beneficiaries who lack the required work credits into three mutually exclusive categories: late-arriving immigrants, infrequent workers, and noncovered workers.
The majority (55.2 percent) of never-beneficiaries are late-arriving immigrants, or those who arrive in the United States at age 50 or older. Because they enter the United States at older ages, late-arriving immigrants are less able than nonimmigrants and early-arriving immigrants to accumulate the required QCs.9
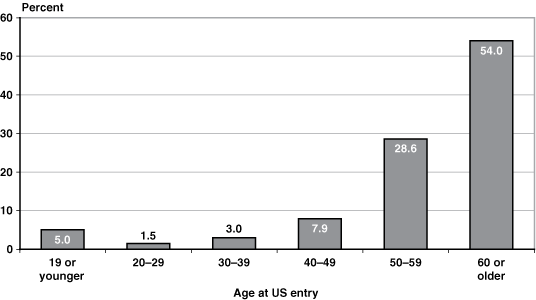
As shown in Chart 3, nearly 83 percent of never-beneficiaries who are immigrants with insufficient earnings histories entered the country at age 50 or older. A possible explanation for this pattern is that many late-arriving immigrants are parents entering the United States to live with their adult children under US immigration family reunification guidelines. Among persons acquiring legal permanent resident status in fiscal year 2008, nearly 11 percent were parents of US citizens (DHS 2009, Table 6).
Percentage distribution of immigrant never-beneficiaries with insufficient earnings histories to qualify for benefits, by age at US entry

Chart 2 shows that about one-third (34.7 percent) of never-beneficiaries are infrequent workers: individuals who lack sufficient work credits and do not have substantial noncovered employment, but are not late-arriving immigrants.10 Almost all are far from having sufficient covered earnings; 99 percent have fewer than half of the QCs required for Social Security benefits. They also do not have enough noncovered earnings to be included in the noncovered workers category. Also, because of their insubstantial work history, infrequent workers do not qualify for Disability Insurance benefits. Although it is difficult to analyze using MINT projections, some of the potential life experiences that could lead individuals to be included in the infrequent worker category are consistent employment in the informal economy, repeated marriages lasting fewer than 10 years and ending in divorce, and partnership in a single-earner couple in which the employed spouse works in a noncovered position. These factors could cause an individual not to have enough work history to qualify for his or her own benefit, or not to have the right marital situation to qualify for spousal benefits.
The small remaining group (4.7 percent) of never-beneficiaries is noncovered workers, many of whom are employed by state and local governments.11 It is impossible to identify individuals with long-term state and local government employment precisely in MINT; however, we approximate this characteristic by identifying individuals who have at least 10 years of noncovered annual earnings that meet or exceed the level needed to earn four Social Security QCs in that year. Our method is described in the appendix.
Poverty and Income among Late-Arriving Immigrants and Infrequent Workers
Although the overall poverty rate for never-beneficiaries is 44.3 percent, poverty rates among the never-beneficiary categories vary considerably. Whereas 43.2 percent of late-arriving immigrants and 57.2 percent of infrequent workers are in poverty in 2010, noncovered workers and those who die before receiving benefits have poverty rates much closer to the 3.7 percent poverty rate of current and future beneficiaries (Chart 4). The high poverty rates for late-arriving immigrants and infrequent workers drive the overall never-beneficiary poverty rate shown in Chart 1 because these groups together constitute roughly 90 percent of the never-beneficiary population.
Poverty rates of never-beneficiaries aged 62–84, by category

As indicated by the high poverty rate for late-arriving immigrants and infrequent workers, these groups have few other income sources (Table 3). For both late-arriving immigrants and infrequent workers, assets are the most common source of income. Around 65 percent of late-arriving immigrants and 71 percent of infrequent workers have asset income, although this is still far below the rate for current and future beneficiaries (95 percent) and the median dollar value of this income is substantially less for never-beneficiaries.
| Household income source | Current and future beneficiaries | Never-beneficiaries | |||||||
|---|---|---|---|---|---|---|---|---|---|
| Late-arriving immigrants | Infrequent workers | ||||||||
| Individuals with income (%) | Median amount ($) a | Share of household income (%) b | Individuals with income (%) | Median amount ($) a | Share of household income (%) b | Individuals with income (%) | Median amount ($) a | Share of household income (%) b | |
| Social Security benefits | 91.7 | 19,058 | 38.7 | . . . | . . . | . . . | . . . | . . . | . . . |
| Earnings | 41.7 | 33,703 | 17.3 | 18.0 | 14,434 | 10.4 | 6.9 | 20,167 | 4.7 |
| Defined-benefit (DB) pension | 52.5 | 11,870 | 11.1 | 24.4 | 11,466 | 12.6 | 19.5 | 19,074 | 10.0 |
| Asset income | 94.8 | 12,140 | 27.2 | 65.2 | 1,174 | 29.8 | 70.5 | 1,154 | 35.9 |
| SSI | 1.0 | 1,292 | 0.2 | 14.5 | 7,644 | 10.6 | 31.2 | 7,644 | 29.1 |
| Coresident income | 12.9 | 22,373 | 5.5 | 37.1 | 81,542 | 36.5 | 22.1 | 33,693 | 20.2 |
| Total | 100.0 | 60,148 | 100.0 | 92.2 | 34,754 | 100.0 | 95.1 | 11,553 | 100.0 |
| SOURCE: Authors' calculations for individuals aged 62–84 in 2010 using Social Security Administration's MINT model. | |||||||||
| NOTES: . . . = not applicable. | |||||||||
| Distributions do not necessarily sum to 100 because of rounding. | |||||||||
| a. Calculations reflect only those individuals with positive household income from that source. | |||||||||
| b. Reflects all individuals within the category, including those with zero dollars from that source. | |||||||||
Table 3 also shows the relative reliance on different income sources among individuals in the different beneficiary categories. For many infrequent workers, SSI is a substantial source of additional income.12 Approximately 31 percent of infrequent workers have income from SSI. SSI represents 29.1 percent of all household income among infrequent workers. Infrequent workers who do not receive SSI may be ineligible because they have income or assets over the allowed limits, or they may be eligible nonparticipants.
Among late-arriving immigrants, the proportion receiving SSI is 14.5 percent and the share of household income it represents is 10.6 percent, far lower than for infrequent workers. The limited SSI receipt among this group is largely a result of rules that limit the circumstances under which immigrants can receive SSI (SSA 2010b). Immigrants entering the United States after August 22, 1996, are generally not eligible for SSI unless they become citizens or gain 40 QCs (Friedland and Pankaj 1997). Even though the proportion of late-arriving immigrants receiving SSI is smaller than that of infrequent workers, larger proportions of both groups receive SSI than do the 1 percent of current and future Social Security beneficiaries.
Table 3 indicates that one critical source of economic support among late-arriving immigrants is coresident income, or income from household members other than the spouse. Among late-arriving immigrants, 37.1 percent live in households that have coresident income, the median value of which is $81,542. Coresident income is the largest single source of household income among late-arriving immigrants, accounting for 36.5 percent of all household income. In comparison, 12.9 percent of current and future beneficiaries live in households that have coresident income, the median amount is $22,373, and it accounts for less than 6 percent of overall household income. Coresident income is also more prevalent among infrequent workers than current and future beneficiaries, but not to the same extent as for late-arriving immigrants. The high share of late-arriving immigrants who are in households with coresident income is consistent with the supposition that many enter the United States to live with adult children.
Conclusion
Few studies have focused on aged individuals who never receive OASDI benefits. Our analysis using the MINT microsimulation model indicates that never-beneficiaries are a small share of the aged population, projected to be roughly 4 percent of the population aged 62–84 in 2010, with late-arriving immigrants and infrequent workers composing the vast majority (around 90 percent) of the group. However, despite representing only a modest percentage of the aged population, never-beneficiaries are notable from a social welfare standpoint because of their high poverty rates. Late-arriving immigrants and infrequent workers drive this result, with poverty rates of around 43 and 57 percent, respectively. These poverty rates coincide with the finding that these two groups not only receive no Social Security income, they also have little income from non–Social Security sources. Among the income sources that are available, coresident income plays a large role for late-arriving immigrants, while infrequent workers are particularly reliant on SSI. Future research could better delineate the life experiences that lead to never receiving Social Security benefits as well as the resulting economic implications. Such analysis would improve our understanding of the aged population as a whole and the policies that affect their well-being.
Appendix
To illustrate how we classify certain sporadic earners as noncovered workers, consider an individual with noncovered earnings from 1990 to 1999 as shown in Table A-1. We compare these earnings figures to the Social Security QC earnings threshold, multiplied by four to provide an annual approximation (SSA 2010a). Then we compare the two values in each year and record the number of times an individual's noncovered earnings exceed the annualized QC value. In this example, between 1990 and 1999 the hypothetical worker has noncovered earnings that exceed our annualized QC limit five times. If an individual's noncovered earnings exceed this threshold at least ten times over a lifetime, we classify the individual as a noncovered worker, because he or she has consistent noncovered employment.
| Year | Noncovered earnings ($) | QC threshold x 4 ($) | Noncovered earnings exceed 4 QCs? |
|---|---|---|---|
| 1990 | 15,000 | 2,080 | Yes |
| 1991 | 7,000 | 2,160 | Yes |
| 1992 | 0 | 2,280 | No |
| 1993 | 0 | 2,360 | No |
| 1994 | 0 | 2,480 | No |
| 1995 | 25,000 | 2,520 | Yes |
| 1996 | 37,000 | 2,560 | Yes |
| 1997 | 8,000 | 2,680 | Yes |
| 1998 | 0 | 2,800 | No |
| 1999 | 0 | 2,960 | No |
| SOURCES: Authors' calculations; SSA (2010a). | |||
A small percentage of those who have covered earnings sufficient to receive Social Security benefits, but who die before receiving them, are also projected to have substantial noncovered earnings. Because our constructed categories are mutually exclusive, these individuals are classified as workers who die before receiving benefits rather than noncovered workers.
Notes
1 According to authors' calculations using the 2010 Current Population Survey.
2 The projections used in the analysis are from MINT 5, which includes people born from 1926 to 2018 (Smith and others 2007). Therefore, in 2010 the available elderly population includes people aged 62–84. The Census Bureau (2008) projects that approximately 90 percent of people aged 62 or older in 2010 will be aged 62–84.
3 The percentage of the aged population that never receives Social Security benefits is projected to decline from 3.7 percent in 2010 to 3.6 percent in 2015, 3.3 percent in 2020, 3.2 percent in 2025, and 3.1 percent in 2030.
4 For more information on elderly poverty, see Engelhardt and Gruber (2004).
5 Official poverty in the United States is measured using the Current Population Survey (CPS), a household survey that directly asks respondents about several different types of income. Although MINT model simulations are rooted in household survey data (1990–1996 Surveys of Income and Program Participation), they differ from direct household survey data in that they project future income amounts, simulate outcomes for individuals in future populations (including immigrants), and focus on five major sources of income. We note that the most recent CPS confirms an elevated poverty rate for individuals likely to be never-beneficiaries, but these rates are below comparable MINT estimates. For example, using the March 2010 CPS, the poverty rates of beneficiaries and nonbeneficiaries aged 70–84 are 6.4 percent and 28.3 percent, respectively.
6 In 2010, an individual earned a QC for every $1,120 in earnings (SSA 2010a). This threshold is indexed to wages. Individuals who possess fewer than 40 QCs and rely on a spouse's earnings would generally not be included in the never-beneficiary category because they would be entitled to spousal benefits if currently married or if a former marriage lasted at least 10 years.
7 Most never-beneficiaries with insufficient earnings histories have substantially fewer years of coverage than would be needed to qualify. One-quarter of never-beneficiaries have no years of coverage, half have only 1 year or less, and 90 percent are still at least 3 years short of the 10-year coverage threshold.
8 This percentage includes individuals who claim benefits but will never actually receive them prior to death because of the retirement earnings test or other program rules, and excludes individuals who have the required 40 quarters in Social Security–covered employment but die prior to reaching age 62. From a lifetime perspective this approach understates the percentage of individuals who die before receiving benefits because it includes only the aged population in 2010.
9 However, late-arriving immigrants could receive benefits based on prior work through totalization agreements, or could receive benefits through another country's public retirement system. The benefit rules for immigrants as well as for noncitizens are complex. See Nuschler and Siskin (2005).
10 We define this group by identifying never-beneficiaries who (1) do not have a positive average indexed monthly earnings (AIME) amount and (2) do not have noncovered earnings that meet the consistent state and local government employment threshold. For a full description of the AIME see http://www.socialsecurity.gov/glossary.htm.
11 Social Security did not originally cover any state or local government employees, but the program has gradually expanded through the 1983 Amendments, the Section 218 Agreements, and the Omnibus Reconciliation Act of 1990 to include many of these workers. Social Security now covers nearly 96 percent of the US workforce; those not covered by the program are still generally employed by state or local governments. The Social Security Administration estimates that nearly one-fourth of state and local government employees, or roughly 5.25 million people (excluding students and election workers), are not covered by Social Security. However, approximately 95 percent of individuals in this group are entitled to some type of Social Security benefit through previous work, the record of a spouse, or dependent status (GAO 2003).
12 The SSI program pays benefits to disabled adults and children who have limited income and resources. SSI benefits are also payable to nondisabled people aged 65 or older who meet certain financial limits (SSA 2010b).
References
Census Bureau. 2008. "U.S. Population Projections." http://www.census.gov/population/www/projections/summarytables.html.
[DHS] Department of Homeland Security. 2009. 2008 Yearbook of Immigration Statistics. Washington, DC: DHS, Office of Immigration Statistics. http://www.dhs.gov/xlibrary/assets/statistics/yearbook/2008/ois_yb_2008.pdf.
Engelhardt, Gary V., and Jonathan Gruber. 2004. "Social Security and the Evolution of Elderly Poverty." NBER Working Paper No. 10466. Cambridge, MA: National Bureau of Economic Research. http://www.nber.org/papers/w10466.pdf?new_window=1.
Friedland, Robert B., and Veena Pankaj. 1997. Welfare Reform and Elderly Legal Immigrants. Washington, DC: National Academy on Aging. http://ihcrp.georgetown.edu/agingsociety/pdfs/welfare.pdf.
[GAO] General Accounting Office. 2003. "Social Security: Issues Relating to Noncoverage of Public Employees. Statement of Barbara D. Bovbjerg, Director, Education, Workforce, and Income Security Issues." Testimony Before the Subcommittee on Social Security, Committee on Ways and Means, House of Representatives, No. GAO-03-710T. Washington, DC: GAO. http://www.gao.gov/new.items/d03710t.pdf.
Nuschler, Dawn, and Alison Siskin. 2005. Social Security Benefits for Noncitizens: Current Policy and Legislation. CRS Report for Congress RL32004. Washington, DC: Congressional Research Service. http://fpc.state.gov/documents/organization/46681.pdf.
Smith, Karen E., Melissa M. Favreault, Caroline Ratcliffe, Barbara Butrica, Eric Toder, and Jon M. Bakija. 2007. Modeling Income in the Near Term 5. Washington, DC: Urban Institute. http://www.urban.org/publications/411571.html.
[SSA] Social Security Administration. 2010a. "Automatic Increases: Quarter of Coverage." SSA, Office of the Chief Actuary. http://www.socialsecurity.gov/OACT/COLA/QC.html.
———. 2010b. What You Need to Know When You Get Supplemental Security Income (SSI). Washington, DC: SSA. http://www.socialsecurity.gov/pubs/11011.pdf.