The Effects of Wage Indexing on Social Security Disability Benefits
by L. Scott Muller
Social Security Bulletin, Vol. 68, No. 3, 2008 (released December 2008)
Social Security Bulletin, Vol. 68, No. 3, 2008 (released December 2008)
Appendix A
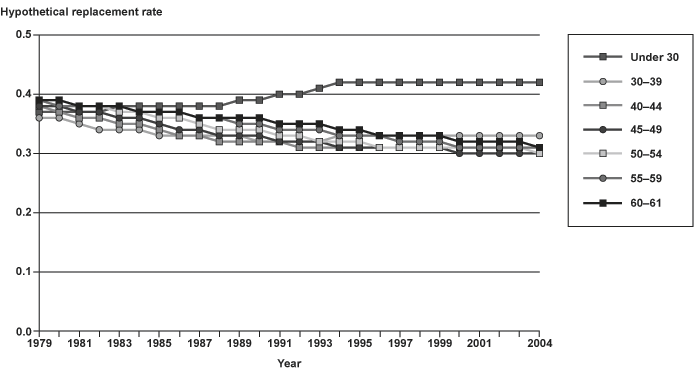
Chart A-1.
Fifth percentile hypothetical replacement rates for disability-insured workers based on lifetime earnings (AIME), by age group, 1979–2004 (see Chart 8)
Fifth percentile hypothetical replacement rates for disability-insured workers based on lifetime earnings (AIME), by age group, 1979–2004 (see Chart 8)
Show as table
| Year | Under 30 | 30–39 | 40–44 | 45–49 | 50–54 | 55–59 | 60–61 |
|---|---|---|---|---|---|---|---|
| 1979 | 0.37 | 0.36 | 0.38 | 0.38 | 0.39 | 0.39 | 0.39 |
| 1980 | 0.37 | 0.36 | 0.37 | 0.38 | 0.38 | 0.38 | 0.39 |
| 1981 | 0.37 | 0.35 | 0.36 | 0.37 | 0.38 | 0.38 | 0.38 |
| 1982 | 0.37 | 0.34 | 0.36 | 0.37 | 0.38 | 0.38 | 0.38 |
| 1983 | 0.38 | 0.34 | 0.35 | 0.36 | 0.37 | 0.38 | 0.38 |
| 1984 | 0.38 | 0.34 | 0.35 | 0.36 | 0.37 | 0.37 | 0.37 |
| 1985 | 0.38 | 0.33 | 0.34 | 0.35 | 0.36 | 0.37 | 0.37 |
| 1986 | 0.38 | 0.33 | 0.33 | 0.34 | 0.36 | 0.37 | 0.37 |
| 1987 | 0.38 | 0.33 | 0.33 | 0.34 | 0.35 | 0.36 | 0.36 |
| 1988 | 0.38 | 0.33 | 0.32 | 0.33 | 0.34 | 0.36 | 0.36 |
| 1989 | 0.39 | 0.33 | 0.32 | 0.33 | 0.34 | 0.35 | 0.36 |
| 1990 | 0.39 | 0.32 | 0.32 | 0.33 | 0.34 | 0.35 | 0.36 |
| 1991 | 0.40 | 0.32 | 0.32 | 0.32 | 0.33 | 0.34 | 0.35 |
| 1992 | 0.40 | 0.32 | 0.31 | 0.32 | 0.33 | 0.34 | 0.35 |
| 1993 | 0.41 | 0.32 | 0.31 | 0.32 | 0.32 | 0.34 | 0.35 |
| 1994 | 0.42 | 0.33 | 0.31 | 0.31 | 0.32 | 0.33 | 0.34 |
| 1995 | 0.42 | 0.33 | 0.31 | 0.31 | 0.32 | 0.33 | 0.34 |
| 1996 | 0.42 | 0.33 | 0.31 | 0.31 | 0.31 | 0.33 | 0.33 |
| 1997 | 0.42 | 0.33 | 0.31 | 0.31 | 0.31 | 0.32 | 0.33 |
| 1998 | 0.42 | 0.33 | 0.31 | 0.31 | 0.31 | 0.32 | 0.33 |
| 1999 | 0.42 | 0.33 | 0.31 | 0.31 | 0.31 | 0.32 | 0.33 |
| 2000 | 0.42 | 0.33 | 0.31 | 0.30 | 0.31 | 0.31 | 0.32 |
| 2001 | 0.42 | 0.33 | 0.31 | 0.30 | 0.31 | 0.31 | 0.32 |
| 2002 | 0.42 | 0.33 | 0.31 | 0.30 | 0.31 | 0.31 | 0.32 |
| 2003 | 0.42 | 0.33 | 0.31 | 0.30 | 0.31 | 0.31 | 0.32 |
| 2004 | 0.42 | 0.33 | 0.31 | 0.30 | 0.30 | 0.31 | 0.31 |
SOURCE: Author's calculations using Continuous Work History Sample data.
NOTE: AIME = average indexed monthly earnings.
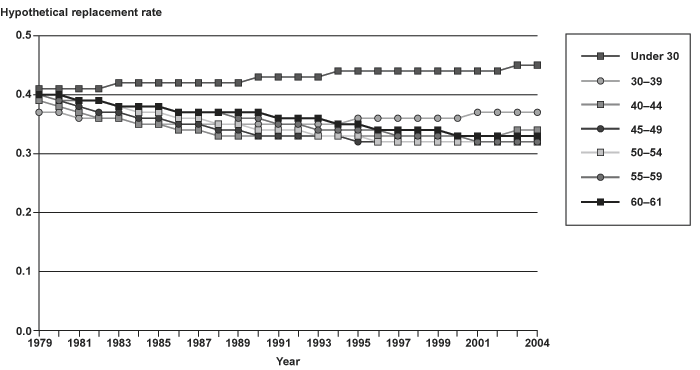
Chart A-2.
Tenth percentile hypothetical replacement rates for disability-insured workers based on lifetime earnings (AIME), by age group, 1979–2004 (see Chart 8)
Tenth percentile hypothetical replacement rates for disability-insured workers based on lifetime earnings (AIME), by age group, 1979–2004 (see Chart 8)
Show as table
| Year | Under 30 | 30–39 | 40–44 | 45–49 | 50–54 | 55–59 | 60–61 |
|---|---|---|---|---|---|---|---|
| 1979 | 0.41 | 0.37 | 0.39 | 0.40 | 0.40 | 0.40 | 0.40 |
| 1980 | 0.41 | 0.37 | 0.38 | 0.39 | 0.39 | 0.39 | 0.40 |
| 1981 | 0.41 | 0.36 | 0.37 | 0.38 | 0.39 | 0.39 | 0.39 |
| 1982 | 0.41 | 0.36 | 0.36 | 0.37 | 0.39 | 0.39 | 0.39 |
| 1983 | 0.42 | 0.36 | 0.36 | 0.37 | 0.38 | 0.38 | 0.38 |
| 1984 | 0.42 | 0.35 | 0.35 | 0.36 | 0.37 | 0.38 | 0.38 |
| 1985 | 0.42 | 0.35 | 0.35 | 0.36 | 0.37 | 0.38 | 0.38 |
| 1986 | 0.42 | 0.35 | 0.34 | 0.35 | 0.36 | 0.37 | 0.37 |
| 1987 | 0.42 | 0.35 | 0.34 | 0.35 | 0.36 | 0.37 | 0.37 |
| 1988 | 0.42 | 0.35 | 0.33 | 0.34 | 0.35 | 0.37 | 0.37 |
| 1989 | 0.42 | 0.35 | 0.33 | 0.34 | 0.35 | 0.36 | 0.37 |
| 1990 | 0.43 | 0.35 | 0.33 | 0.33 | 0.34 | 0.36 | 0.37 |
| 1991 | 0.43 | 0.35 | 0.33 | 0.33 | 0.34 | 0.35 | 0.36 |
| 1992 | 0.43 | 0.35 | 0.33 | 0.33 | 0.34 | 0.35 | 0.36 |
| 1993 | 0.43 | 0.35 | 0.33 | 0.33 | 0.33 | 0.34 | 0.36 |
| 1994 | 0.44 | 0.35 | 0.33 | 0.33 | 0.33 | 0.34 | 0.35 |
| 1995 | 0.44 | 0.36 | 0.33 | 0.32 | 0.33 | 0.34 | 0.35 |
| 1996 | 0.44 | 0.36 | 0.33 | 0.32 | 0.32 | 0.34 | 0.34 |
| 1997 | 0.44 | 0.36 | 0.33 | 0.32 | 0.32 | 0.33 | 0.34 |
| 1998 | 0.44 | 0.36 | 0.33 | 0.32 | 0.32 | 0.33 | 0.34 |
| 1999 | 0.44 | 0.36 | 0.33 | 0.32 | 0.32 | 0.33 | 0.34 |
| 2000 | 0.44 | 0.36 | 0.33 | 0.32 | 0.32 | 0.33 | 0.33 |
| 2001 | 0.44 | 0.37 | 0.33 | 0.32 | 0.32 | 0.32 | 0.33 |
| 2002 | 0.44 | 0.37 | 0.33 | 0.32 | 0.32 | 0.32 | 0.33 |
| 2003 | 0.45 | 0.37 | 0.34 | 0.32 | 0.32 | 0.32 | 0.33 |
| 2004 | 0.45 | 0.37 | 0.34 | 0.32 | 0.32 | 0.32 | 0.33 |
SOURCE: Author's calculations using Continuous Work History Sample data.
NOTE: AIME = average indexed monthly earnings.
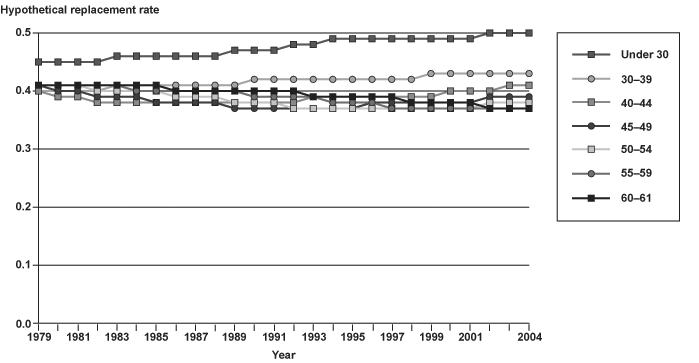
Chart A-3.
Twenty-fifth percentile hypothetical replacement rates for disability-insured workers based on lifetime earnings (AIME), by age group, 1979–2004 (see Chart 8)
Twenty-fifth percentile hypothetical replacement rates for disability-insured workers based on lifetime earnings (AIME), by age group, 1979–2004 (see Chart 8)
Show as table
| Year | Under 30 | 30–39 | 40–44 | 45–49 | 50–54 | 55–59 | 60–61 |
|---|---|---|---|---|---|---|---|
| 1979 | 0.45 | 0.40 | 0.40 | 0.41 | 0.41 | 0.41 | 0.41 |
| 1980 | 0.45 | 0.40 | 0.39 | 0.40 | 0.41 | 0.41 | 0.41 |
| 1981 | 0.45 | 0.40 | 0.39 | 0.40 | 0.41 | 0.41 | 0.41 |
| 1982 | 0.45 | 0.40 | 0.38 | 0.39 | 0.40 | 0.41 | 0.41 |
| 1983 | 0.46 | 0.41 | 0.38 | 0.39 | 0.40 | 0.41 | 0.41 |
| 1984 | 0.46 | 0.41 | 0.38 | 0.39 | 0.40 | 0.40 | 0.41 |
| 1985 | 0.46 | 0.41 | 0.38 | 0.38 | 0.40 | 0.40 | 0.41 |
| 1986 | 0.46 | 0.41 | 0.38 | 0.38 | 0.39 | 0.40 | 0.40 |
| 1987 | 0.46 | 0.41 | 0.38 | 0.38 | 0.39 | 0.40 | 0.40 |
| 1988 | 0.46 | 0.41 | 0.38 | 0.38 | 0.39 | 0.40 | 0.40 |
| 1989 | 0.47 | 0.41 | 0.38 | 0.37 | 0.38 | 0.40 | 0.40 |
| 1990 | 0.47 | 0.42 | 0.38 | 0.37 | 0.38 | 0.39 | 0.40 |
| 1991 | 0.47 | 0.42 | 0.38 | 0.37 | 0.38 | 0.39 | 0.40 |
| 1992 | 0.48 | 0.42 | 0.38 | 0.37 | 0.37 | 0.39 | 0.40 |
| 1993 | 0.48 | 0.42 | 0.39 | 0.37 | 0.37 | 0.39 | 0.39 |
| 1994 | 0.49 | 0.42 | 0.39 | 0.37 | 0.37 | 0.38 | 0.39 |
| 1995 | 0.49 | 0.42 | 0.39 | 0.37 | 0.37 | 0.38 | 0.39 |
| 1996 | 0.49 | 0.42 | 0.39 | 0.38 | 0.37 | 0.38 | 0.39 |
| 1997 | 0.49 | 0.42 | 0.39 | 0.38 | 0.37 | 0.37 | 0.39 |
| 1998 | 0.49 | 0.42 | 0.39 | 0.38 | 0.37 | 0.37 | 0.38 |
| 1999 | 0.49 | 0.43 | 0.39 | 0.38 | 0.37 | 0.37 | 0.38 |
| 2000 | 0.49 | 0.43 | 0.40 | 0.38 | 0.37 | 0.37 | 0.38 |
| 2001 | 0.49 | 0.43 | 0.40 | 0.38 | 0.37 | 0.37 | 0.38 |
| 2002 | 0.50 | 0.43 | 0.40 | 0.39 | 0.38 | 0.37 | 0.37 |
| 2003 | 0.50 | 0.43 | 0.41 | 0.39 | 0.38 | 0.37 | 0.37 |
| 2004 | 0.50 | 0.43 | 0.41 | 0.39 | 0.38 | 0.37 | 0.37 |
SOURCE: Author's calculations using Continuous Work History Sample data.
NOTE: AIME = average indexed monthly earnings.
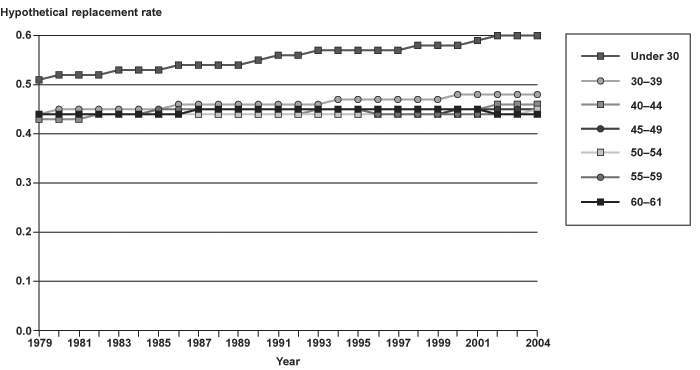
Chart A-4.
Fiftieth percentile hypothetical replacement rates for disability-insured workers based on lifetime earnings (AIME), by age group, 1979–2004 (see Chart 8)
Fiftieth percentile hypothetical replacement rates for disability-insured workers based on lifetime earnings (AIME), by age group, 1979–2004 (see Chart 8)
Show as table
| Year | Under 30 | 30–39 | 40–44 | 45–49 | 50–54 | 55–59 | 60–61 |
|---|---|---|---|---|---|---|---|
| 1979 | 0.51 | 0.44 | 0.43 | 0.44 | 0.44 | 0.44 | 0.44 |
| 1980 | 0.52 | 0.45 | 0.43 | 0.44 | 0.44 | 0.44 | 0.44 |
| 1981 | 0.52 | 0.45 | 0.43 | 0.44 | 0.44 | 0.44 | 0.44 |
| 1982 | 0.52 | 0.45 | 0.44 | 0.44 | 0.44 | 0.44 | 0.44 |
| 1983 | 0.53 | 0.45 | 0.44 | 0.44 | 0.44 | 0.44 | 0.44 |
| 1984 | 0.53 | 0.45 | 0.44 | 0.44 | 0.44 | 0.44 | 0.44 |
| 1985 | 0.53 | 0.45 | 0.44 | 0.44 | 0.44 | 0.45 | 0.44 |
| 1986 | 0.54 | 0.46 | 0.44 | 0.44 | 0.44 | 0.45 | 0.44 |
| 1987 | 0.54 | 0.46 | 0.44 | 0.44 | 0.44 | 0.45 | 0.45 |
| 1988 | 0.54 | 0.46 | 0.44 | 0.44 | 0.44 | 0.45 | 0.45 |
| 1989 | 0.54 | 0.46 | 0.44 | 0.44 | 0.44 | 0.45 | 0.45 |
| 1990 | 0.55 | 0.46 | 0.44 | 0.44 | 0.44 | 0.45 | 0.45 |
| 1991 | 0.56 | 0.46 | 0.44 | 0.44 | 0.44 | 0.45 | 0.45 |
| 1992 | 0.56 | 0.46 | 0.44 | 0.44 | 0.44 | 0.45 | 0.45 |
| 1993 | 0.57 | 0.46 | 0.45 | 0.44 | 0.44 | 0.45 | 0.45 |
| 1994 | 0.57 | 0.47 | 0.45 | 0.44 | 0.44 | 0.45 | 0.45 |
| 1995 | 0.57 | 0.47 | 0.45 | 0.44 | 0.44 | 0.45 | 0.45 |
| 1996 | 0.57 | 0.47 | 0.45 | 0.44 | 0.44 | 0.44 | 0.45 |
| 1997 | 0.57 | 0.47 | 0.45 | 0.44 | 0.44 | 0.44 | 0.45 |
| 1998 | 0.58 | 0.47 | 0.45 | 0.44 | 0.44 | 0.44 | 0.45 |
| 1999 | 0.58 | 0.47 | 0.45 | 0.44 | 0.44 | 0.44 | 0.45 |
| 2000 | 0.58 | 0.48 | 0.45 | 0.45 | 0.44 | 0.44 | 0.45 |
| 2001 | 0.59 | 0.48 | 0.45 | 0.45 | 0.44 | 0.44 | 0.45 |
| 2002 | 0.60 | 0.48 | 0.46 | 0.45 | 0.44 | 0.44 | 0.44 |
| 2003 | 0.60 | 0.48 | 0.46 | 0.45 | 0.44 | 0.44 | 0.44 |
| 2004 | 0.60 | 0.48 | 0.46 | 0.45 | 0.45 | 0.44 | 0.44 |
SOURCE: Author's calculations using Continuous Work History Sample data.
NOTE: AIME = average indexed monthly earnings.
Chart A-5.
Seventy-fifth percentile hypothetical replacement rates for disability-insured workers based on lifetime earnings (AIME), by age group, 1979–2004 (see Chart 8)
Seventy-fifth percentile hypothetical replacement rates for disability-insured workers based on lifetime earnings (AIME), by age group, 1979–2004 (see Chart 8)
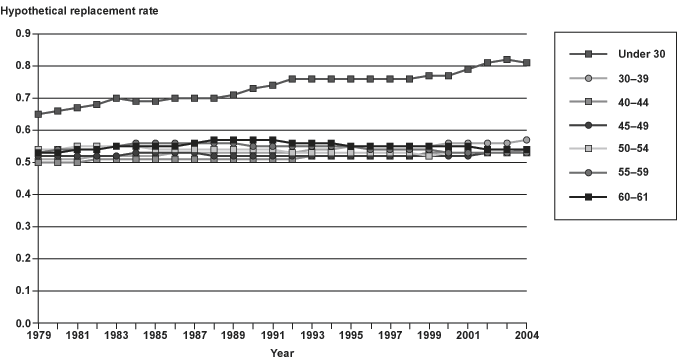
Show as table
| Year | Under 30 | 30–39 | 40–44 | 45–49 | 50–54 | 55–59 | 60–61 |
|---|---|---|---|---|---|---|---|
| 1979 | 0.65 | 0.51 | 0.50 | 0.52 | 0.54 | 0.53 | 0.53 |
| 1980 | 0.66 | 0.51 | 0.50 | 0.52 | 0.54 | 0.54 | 0.53 |
| 1981 | 0.67 | 0.51 | 0.50 | 0.52 | 0.55 | 0.54 | 0.54 |
| 1982 | 0.68 | 0.52 | 0.51 | 0.52 | 0.55 | 0.54 | 0.54 |
| 1983 | 0.70 | 0.52 | 0.51 | 0.52 | 0.55 | 0.55 | 0.55 |
| 1984 | 0.69 | 0.52 | 0.51 | 0.53 | 0.55 | 0.56 | 0.55 |
| 1985 | 0.69 | 0.52 | 0.51 | 0.53 | 0.54 | 0.56 | 0.55 |
| 1986 | 0.70 | 0.53 | 0.51 | 0.53 | 0.54 | 0.56 | 0.55 |
| 1987 | 0.70 | 0.53 | 0.51 | 0.53 | 0.54 | 0.56 | 0.56 |
| 1988 | 0.70 | 0.53 | 0.51 | 0.52 | 0.54 | 0.56 | 0.57 |
| 1989 | 0.71 | 0.53 | 0.51 | 0.52 | 0.54 | 0.56 | 0.57 |
| 1990 | 0.73 | 0.53 | 0.51 | 0.52 | 0.54 | 0.55 | 0.57 |
| 1991 | 0.74 | 0.53 | 0.51 | 0.52 | 0.54 | 0.55 | 0.57 |
| 1992 | 0.76 | 0.53 | 0.51 | 0.52 | 0.53 | 0.55 | 0.56 |
| 1993 | 0.76 | 0.54 | 0.52 | 0.52 | 0.53 | 0.55 | 0.56 |
| 1994 | 0.76 | 0.54 | 0.52 | 0.52 | 0.53 | 0.55 | 0.56 |
| 1995 | 0.76 | 0.55 | 0.52 | 0.52 | 0.53 | 0.55 | 0.55 |
| 1996 | 0.76 | 0.55 | 0.52 | 0.52 | 0.53 | 0.54 | 0.55 |
| 1997 | 0.76 | 0.55 | 0.52 | 0.52 | 0.53 | 0.54 | 0.55 |
| 1998 | 0.76 | 0.55 | 0.52 | 0.52 | 0.53 | 0.54 | 0.55 |
| 1999 | 0.77 | 0.55 | 0.53 | 0.52 | 0.52 | 0.54 | 0.55 |
| 2000 | 0.77 | 0.56 | 0.53 | 0.52 | 0.53 | 0.53 | 0.55 |
| 2001 | 0.79 | 0.56 | 0.53 | 0.52 | 0.53 | 0.53 | 0.55 |
| 2002 | 0.81 | 0.56 | 0.53 | 0.53 | 0.53 | 0.53 | 0.54 |
| 2003 | 0.82 | 0.56 | 0.53 | 0.53 | 0.53 | 0.53 | 0.54 |
| 2004 | 0.81 | 0.57 | 0.54 | 0.53 | 0.53 | 0.53 | 0.54 |
SOURCE: Author's calculations using Continuous Work History Sample data.
NOTE: AIME = average indexed monthly earnings.
Chart A-6.
Ninetieth percentile hypothetical replacement rates for disability-insured workers based on lifetime earnings (AIME), by age group, 1979–2004 (see Chart 8)
Ninetieth percentile hypothetical replacement rates for disability-insured workers based on lifetime earnings (AIME), by age group, 1979–2004 (see Chart 8)
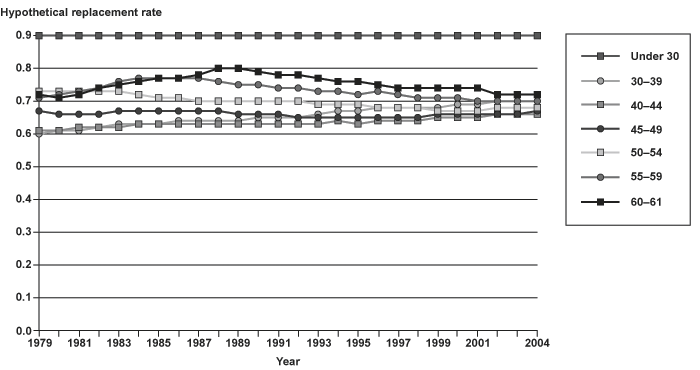
Show as table
| Year | Under 30 | 30–39 | 40–44 | 45–49 | 50–54 | 55–59 | 60–61 |
|---|---|---|---|---|---|---|---|
| 1979 | 0.90 | 0.60 | 0.61 | 0.67 | 0.73 | 0.71 | 0.72 |
| 1980 | 0.90 | 0.61 | 0.61 | 0.66 | 0.73 | 0.72 | 0.71 |
| 1981 | 0.90 | 0.61 | 0.62 | 0.66 | 0.73 | 0.73 | 0.72 |
| 1982 | 0.90 | 0.62 | 0.62 | 0.66 | 0.73 | 0.74 | 0.74 |
| 1983 | 0.90 | 0.63 | 0.62 | 0.67 | 0.73 | 0.76 | 0.75 |
| 1984 | 0.90 | 0.63 | 0.63 | 0.67 | 0.72 | 0.77 | 0.76 |
| 1985 | 0.90 | 0.63 | 0.63 | 0.67 | 0.71 | 0.77 | 0.77 |
| 1986 | 0.90 | 0.64 | 0.63 | 0.67 | 0.71 | 0.77 | 0.77 |
| 1987 | 0.90 | 0.64 | 0.63 | 0.67 | 0.70 | 0.77 | 0.78 |
| 1988 | 0.90 | 0.64 | 0.63 | 0.67 | 0.70 | 0.76 | 0.80 |
| 1989 | 0.90 | 0.64 | 0.63 | 0.66 | 0.70 | 0.75 | 0.80 |
| 1990 | 0.90 | 0.65 | 0.63 | 0.66 | 0.70 | 0.75 | 0.79 |
| 1991 | 0.90 | 0.65 | 0.63 | 0.66 | 0.70 | 0.74 | 0.78 |
| 1992 | 0.90 | 0.65 | 0.63 | 0.65 | 0.70 | 0.74 | 0.78 |
| 1993 | 0.90 | 0.66 | 0.63 | 0.65 | 0.69 | 0.73 | 0.77 |
| 1994 | 0.90 | 0.67 | 0.64 | 0.65 | 0.69 | 0.73 | 0.76 |
| 1995 | 0.90 | 0.67 | 0.63 | 0.65 | 0.69 | 0.72 | 0.76 |
| 1996 | 0.90 | 0.68 | 0.64 | 0.65 | 0.68 | 0.73 | 0.75 |
| 1997 | 0.90 | 0.68 | 0.64 | 0.65 | 0.68 | 0.72 | 0.74 |
| 1998 | 0.90 | 0.68 | 0.64 | 0.65 | 0.68 | 0.71 | 0.74 |
| 1999 | 0.90 | 0.68 | 0.65 | 0.66 | 0.67 | 0.71 | 0.74 |
| 2000 | 0.90 | 0.69 | 0.65 | 0.66 | 0.67 | 0.71 | 0.74 |
| 2001 | 0.90 | 0.69 | 0.65 | 0.66 | 0.67 | 0.70 | 0.74 |
| 2002 | 0.90 | 0.70 | 0.66 | 0.66 | 0.68 | 0.70 | 0.72 |
| 2003 | 0.90 | 0.70 | 0.66 | 0.66 | 0.68 | 0.70 | 0.72 |
| 2004 | 0.90 | 0.70 | 0.66 | 0.67 | 0.68 | 0.70 | 0.72 |
SOURCE: Author's calculations using Continuous Work History Sample data.
NOTE: AIME = average indexed monthly earnings.
Chart A-7.
Ninety-fifth percentile hypothetical replacement rates for disability-insured workers based on lifetime earnings (AIME), by age group, 1979–2004 (see Chart 8)
Ninety-fifth percentile hypothetical replacement rates for disability-insured workers based on lifetime earnings (AIME), by age group, 1979–2004 (see Chart 8)
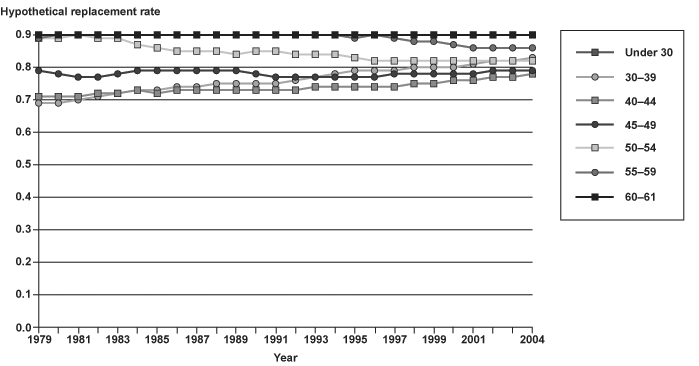
Show as table
| Year | Under 30 | 30–39 | 40–44 | 45–49 | 50–54 | 55–59 | 60–61 |
|---|---|---|---|---|---|---|---|
| 1979 | 0.90 | 0.69 | 0.71 | 0.79 | 0.89 | 0.89 | 0.90 |
| 1980 | 0.90 | 0.69 | 0.71 | 0.78 | 0.89 | 0.90 | 0.90 |
| 1981 | 0.90 | 0.70 | 0.71 | 0.77 | 0.90 | 0.90 | 0.90 |
| 1982 | 0.90 | 0.71 | 0.72 | 0.77 | 0.89 | 0.90 | 0.90 |
| 1983 | 0.90 | 0.72 | 0.72 | 0.78 | 0.89 | 0.90 | 0.90 |
| 1984 | 0.90 | 0.73 | 0.73 | 0.79 | 0.87 | 0.90 | 0.90 |
| 1985 | 0.90 | 0.73 | 0.72 | 0.79 | 0.86 | 0.90 | 0.90 |
| 1986 | 0.90 | 0.74 | 0.73 | 0.79 | 0.85 | 0.90 | 0.90 |
| 1987 | 0.90 | 0.74 | 0.73 | 0.79 | 0.85 | 0.90 | 0.90 |
| 1988 | 0.90 | 0.75 | 0.73 | 0.79 | 0.85 | 0.90 | 0.90 |
| 1989 | 0.90 | 0.75 | 0.73 | 0.79 | 0.84 | 0.90 | 0.90 |
| 1990 | 0.90 | 0.75 | 0.73 | 0.78 | 0.85 | 0.90 | 0.90 |
| 1991 | 0.90 | 0.75 | 0.73 | 0.77 | 0.85 | 0.90 | 0.90 |
| 1992 | 0.90 | 0.76 | 0.73 | 0.77 | 0.84 | 0.90 | 0.90 |
| 1993 | 0.90 | 0.77 | 0.74 | 0.77 | 0.84 | 0.90 | 0.90 |
| 1994 | 0.90 | 0.78 | 0.74 | 0.77 | 0.84 | 0.90 | 0.90 |
| 1995 | 0.90 | 0.79 | 0.74 | 0.77 | 0.83 | 0.89 | 0.90 |
| 1996 | 0.90 | 0.79 | 0.74 | 0.77 | 0.82 | 0.90 | 0.90 |
| 1997 | 0.90 | 0.79 | 0.74 | 0.78 | 0.82 | 0.89 | 0.90 |
| 1998 | 0.90 | 0.80 | 0.75 | 0.78 | 0.82 | 0.88 | 0.90 |
| 1999 | 0.90 | 0.80 | 0.75 | 0.78 | 0.82 | 0.88 | 0.90 |
| 2000 | 0.90 | 0.80 | 0.76 | 0.78 | 0.82 | 0.87 | 0.90 |
| 2001 | 0.90 | 0.81 | 0.76 | 0.78 | 0.82 | 0.86 | 0.90 |
| 2002 | 0.90 | 0.82 | 0.77 | 0.79 | 0.82 | 0.86 | 0.90 |
| 2003 | 0.90 | 0.82 | 0.77 | 0.79 | 0.82 | 0.86 | 0.90 |
| 2004 | 0.90 | 0.83 | 0.78 | 0.79 | 0.82 | 0.86 | 0.90 |
SOURCE: Author's calculations using Continuous Work History Sample data.
NOTE: AIME = average indexed monthly earnings.
Chart A-8.
Fifth percentile hypothetical replacement rates for disability-insured workers based on last year of nonzero earnings (indexed to CPI), by age group, 1979–2004 (see Chart 9)
Fifth percentile hypothetical replacement rates for disability-insured workers based on last year of nonzero earnings (indexed to CPI), by age group, 1979–2004 (see Chart 9)
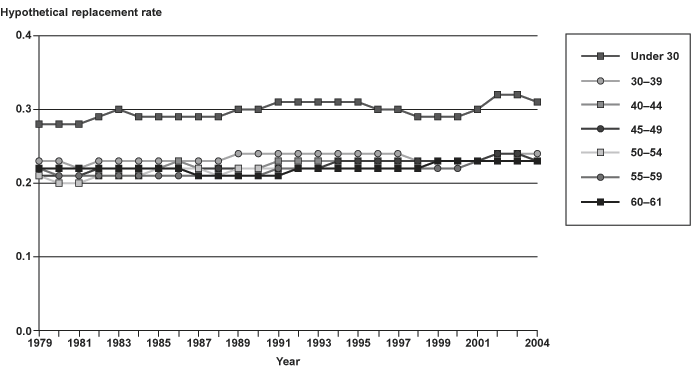
Show as table
| Year | Under 30 | 30–39 | 40–44 | 45–49 | 50–54 | 55–59 | 60–61 |
|---|---|---|---|---|---|---|---|
| 1979 | 0.28 | 0.23 | 0.22 | 0.21 | 0.21 | 0.22 | 0.22 |
| 1980 | 0.28 | 0.23 | 0.22 | 0.21 | 0.20 | 0.21 | 0.22 |
| 1981 | 0.28 | 0.22 | 0.22 | 0.21 | 0.20 | 0.21 | 0.22 |
| 1982 | 0.29 | 0.23 | 0.22 | 0.22 | 0.21 | 0.21 | 0.22 |
| 1983 | 0.30 | 0.23 | 0.22 | 0.22 | 0.21 | 0.21 | 0.22 |
| 1984 | 0.29 | 0.23 | 0.22 | 0.22 | 0.21 | 0.21 | 0.22 |
| 1985 | 0.29 | 0.23 | 0.22 | 0.22 | 0.22 | 0.21 | 0.22 |
| 1986 | 0.29 | 0.23 | 0.23 | 0.22 | 0.22 | 0.21 | 0.22 |
| 1987 | 0.29 | 0.23 | 0.22 | 0.22 | 0.22 | 0.21 | 0.21 |
| 1988 | 0.29 | 0.23 | 0.22 | 0.22 | 0.21 | 0.21 | 0.21 |
| 1989 | 0.30 | 0.24 | 0.22 | 0.22 | 0.22 | 0.21 | 0.21 |
| 1990 | 0.30 | 0.24 | 0.22 | 0.22 | 0.22 | 0.21 | 0.21 |
| 1991 | 0.31 | 0.24 | 0.23 | 0.22 | 0.22 | 0.22 | 0.21 |
| 1992 | 0.31 | 0.24 | 0.23 | 0.22 | 0.22 | 0.22 | 0.22 |
| 1993 | 0.31 | 0.24 | 0.23 | 0.22 | 0.22 | 0.22 | 0.22 |
| 1994 | 0.31 | 0.24 | 0.23 | 0.23 | 0.22 | 0.22 | 0.22 |
| 1995 | 0.31 | 0.24 | 0.23 | 0.23 | 0.22 | 0.22 | 0.22 |
| 1996 | 0.30 | 0.24 | 0.23 | 0.23 | 0.22 | 0.22 | 0.22 |
| 1997 | 0.30 | 0.24 | 0.23 | 0.23 | 0.22 | 0.22 | 0.22 |
| 1998 | 0.29 | 0.23 | 0.23 | 0.23 | 0.22 | 0.22 | 0.22 |
| 1999 | 0.29 | 0.23 | 0.23 | 0.23 | 0.23 | 0.22 | 0.23 |
| 2000 | 0.29 | 0.23 | 0.23 | 0.23 | 0.23 | 0.22 | 0.23 |
| 2001 | 0.30 | 0.23 | 0.23 | 0.23 | 0.23 | 0.23 | 0.23 |
| 2002 | 0.32 | 0.24 | 0.24 | 0.24 | 0.23 | 0.23 | 0.23 |
| 2003 | 0.32 | 0.24 | 0.24 | 0.24 | 0.23 | 0.23 | 0.23 |
| 2004 | 0.31 | 0.24 | 0.23 | 0.23 | 0.23 | 0.23 | 0.23 |
SOURCE: Author's calculations using Continuous Work History Sample data.
NOTE: CPI = Consumer Price Index.
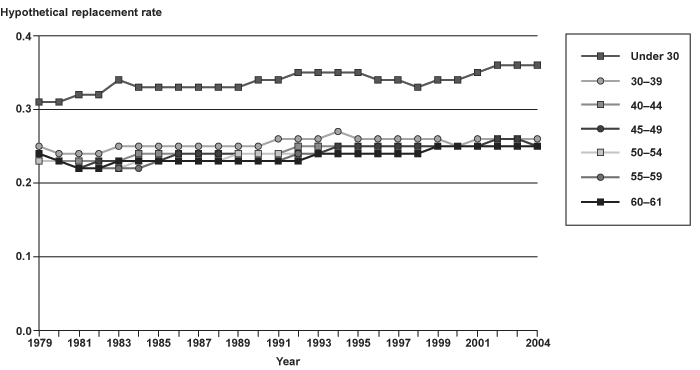
Chart A-9.
Tenth percentile hypothetical replacement rates for disability-insured workers based on last year of nonzero earnings (indexed to CPI), by age group, 1979–2004 (see Chart 9)
Tenth percentile hypothetical replacement rates for disability-insured workers based on last year of nonzero earnings (indexed to CPI), by age group, 1979–2004 (see Chart 9)
Show as table
| Year | Under 30 | 30–39 | 40–44 | 45–49 | 50–54 | 55–59 | 60–61 |
|---|---|---|---|---|---|---|---|
| 1979 | 0.31 | 0.25 | 0.24 | 0.23 | 0.23 | 0.24 | 0.24 |
| 1980 | 0.31 | 0.24 | 0.23 | 0.23 | 0.23 | 0.23 | 0.23 |
| 1981 | 0.32 | 0.24 | 0.23 | 0.22 | 0.22 | 0.22 | 0.22 |
| 1982 | 0.32 | 0.24 | 0.23 | 0.23 | 0.22 | 0.22 | 0.22 |
| 1983 | 0.34 | 0.25 | 0.23 | 0.23 | 0.22 | 0.22 | 0.23 |
| 1984 | 0.33 | 0.25 | 0.24 | 0.23 | 0.23 | 0.22 | 0.23 |
| 1985 | 0.33 | 0.25 | 0.24 | 0.23 | 0.23 | 0.23 | 0.23 |
| 1986 | 0.33 | 0.25 | 0.24 | 0.24 | 0.23 | 0.23 | 0.23 |
| 1987 | 0.33 | 0.25 | 0.24 | 0.24 | 0.23 | 0.23 | 0.23 |
| 1988 | 0.33 | 0.25 | 0.24 | 0.24 | 0.23 | 0.23 | 0.23 |
| 1989 | 0.33 | 0.25 | 0.24 | 0.24 | 0.24 | 0.23 | 0.23 |
| 1990 | 0.34 | 0.25 | 0.24 | 0.24 | 0.24 | 0.23 | 0.23 |
| 1991 | 0.34 | 0.26 | 0.24 | 0.24 | 0.24 | 0.23 | 0.23 |
| 1992 | 0.35 | 0.26 | 0.25 | 0.24 | 0.24 | 0.24 | 0.23 |
| 1993 | 0.35 | 0.26 | 0.25 | 0.24 | 0.24 | 0.24 | 0.24 |
| 1994 | 0.35 | 0.27 | 0.25 | 0.25 | 0.24 | 0.24 | 0.24 |
| 1995 | 0.35 | 0.26 | 0.25 | 0.25 | 0.24 | 0.24 | 0.24 |
| 1996 | 0.34 | 0.26 | 0.25 | 0.25 | 0.24 | 0.24 | 0.24 |
| 1997 | 0.34 | 0.26 | 0.25 | 0.25 | 0.24 | 0.24 | 0.24 |
| 1998 | 0.33 | 0.26 | 0.25 | 0.25 | 0.24 | 0.24 | 0.24 |
| 1999 | 0.34 | 0.26 | 0.25 | 0.25 | 0.25 | 0.25 | 0.25 |
| 2000 | 0.34 | 0.25 | 0.25 | 0.25 | 0.25 | 0.25 | 0.25 |
| 2001 | 0.35 | 0.26 | 0.25 | 0.25 | 0.25 | 0.25 | 0.25 |
| 2002 | 0.36 | 0.26 | 0.26 | 0.26 | 0.25 | 0.25 | 0.25 |
| 2003 | 0.36 | 0.26 | 0.26 | 0.26 | 0.25 | 0.25 | 0.25 |
| 2004 | 0.36 | 0.26 | 0.25 | 0.25 | 0.25 | 0.25 | 0.25 |
SOURCE: Author's calculations using Continuous Work History Sample data.
NOTE: CPI = Consumer Price Index.
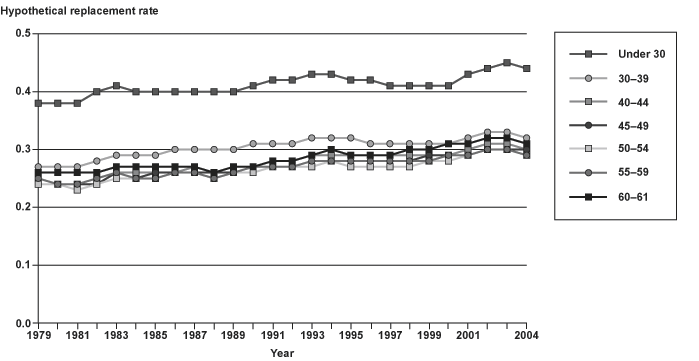
Chart A-10.
Twenty-fifth percentile hypothetical replacement rates for disability-insured workers based on last year of nonzero earnings (indexed to CPI), by age group, 1979–2004 (see Chart 9)
Twenty-fifth percentile hypothetical replacement rates for disability-insured workers based on last year of nonzero earnings (indexed to CPI), by age group, 1979–2004 (see Chart 9)
Show as table
| Year | Under 30 | 30–39 | 40–44 | 45–49 | 50–54 | 55–59 | 60–61 |
|---|---|---|---|---|---|---|---|
| 1979 | 0.38 | 0.27 | 0.25 | 0.24 | 0.24 | 0.25 | 0.26 |
| 1980 | 0.38 | 0.27 | 0.24 | 0.24 | 0.24 | 0.24 | 0.26 |
| 1981 | 0.38 | 0.27 | 0.24 | 0.24 | 0.23 | 0.24 | 0.26 |
| 1982 | 0.40 | 0.28 | 0.25 | 0.24 | 0.24 | 0.25 | 0.26 |
| 1983 | 0.41 | 0.29 | 0.26 | 0.26 | 0.25 | 0.26 | 0.27 |
| 1984 | 0.40 | 0.29 | 0.26 | 0.25 | 0.25 | 0.25 | 0.27 |
| 1985 | 0.40 | 0.29 | 0.26 | 0.26 | 0.25 | 0.25 | 0.27 |
| 1986 | 0.40 | 0.30 | 0.26 | 0.26 | 0.26 | 0.26 | 0.27 |
| 1987 | 0.40 | 0.30 | 0.27 | 0.26 | 0.26 | 0.26 | 0.27 |
| 1988 | 0.40 | 0.30 | 0.26 | 0.26 | 0.25 | 0.25 | 0.26 |
| 1989 | 0.40 | 0.30 | 0.27 | 0.26 | 0.26 | 0.26 | 0.27 |
| 1990 | 0.41 | 0.31 | 0.27 | 0.26 | 0.26 | 0.27 | 0.27 |
| 1991 | 0.42 | 0.31 | 0.28 | 0.27 | 0.27 | 0.27 | 0.28 |
| 1992 | 0.42 | 0.31 | 0.28 | 0.27 | 0.27 | 0.27 | 0.28 |
| 1993 | 0.43 | 0.32 | 0.29 | 0.27 | 0.27 | 0.28 | 0.29 |
| 1994 | 0.43 | 0.32 | 0.29 | 0.28 | 0.28 | 0.28 | 0.30 |
| 1995 | 0.42 | 0.32 | 0.29 | 0.28 | 0.27 | 0.28 | 0.29 |
| 1996 | 0.42 | 0.31 | 0.29 | 0.28 | 0.27 | 0.28 | 0.29 |
| 1997 | 0.41 | 0.31 | 0.29 | 0.28 | 0.27 | 0.28 | 0.29 |
| 1998 | 0.41 | 0.31 | 0.29 | 0.28 | 0.27 | 0.28 | 0.30 |
| 1999 | 0.41 | 0.31 | 0.29 | 0.29 | 0.28 | 0.28 | 0.30 |
| 2000 | 0.41 | 0.31 | 0.29 | 0.29 | 0.28 | 0.29 | 0.31 |
| 2001 | 0.43 | 0.32 | 0.30 | 0.29 | 0.29 | 0.29 | 0.31 |
| 2002 | 0.44 | 0.33 | 0.31 | 0.30 | 0.30 | 0.30 | 0.32 |
| 2003 | 0.45 | 0.33 | 0.31 | 0.30 | 0.30 | 0.30 | 0.32 |
| 2004 | 0.44 | 0.32 | 0.30 | 0.30 | 0.29 | 0.29 | 0.31 |
SOURCE: Author's calculations using Continuous Work History Sample data.
NOTE: CPI = Consumer Price Index.
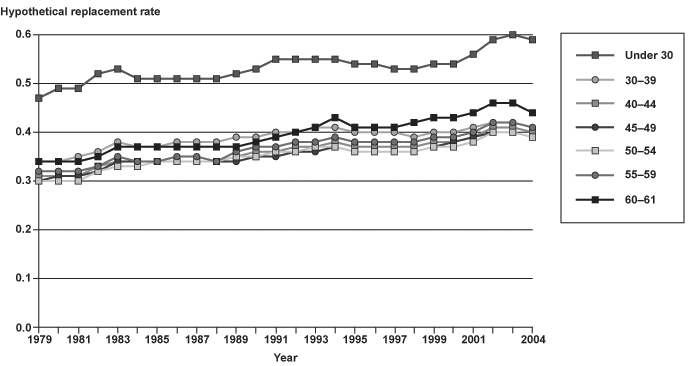
Chart A-11.
Fiftieth percentile hypothetical replacement rates for disability-insured workers based on last year of nonzero earnings (indexed to CPI), by age group, 1979–2004 (see Chart 9)
Fiftieth percentile hypothetical replacement rates for disability-insured workers based on last year of nonzero earnings (indexed to CPI), by age group, 1979–2004 (see Chart 9)
Show as table
| Year | Under 30 | 30–39 | 40–44 | 45–49 | 50–54 | 55–59 | 60–61 |
|---|---|---|---|---|---|---|---|
| 1979 | 0.47 | 0.34 | 0.31 | 0.30 | 0.30 | 0.32 | 0.34 |
| 1980 | 0.49 | 0.34 | 0.31 | 0.31 | 0.30 | 0.32 | 0.34 |
| 1981 | 0.49 | 0.35 | 0.31 | 0.31 | 0.30 | 0.32 | 0.34 |
| 1982 | 0.52 | 0.36 | 0.33 | 0.32 | 0.32 | 0.33 | 0.35 |
| 1983 | 0.53 | 0.38 | 0.34 | 0.34 | 0.33 | 0.35 | 0.37 |
| 1984 | 0.51 | 0.37 | 0.34 | 0.34 | 0.33 | 0.34 | 0.37 |
| 1985 | 0.51 | 0.37 | 0.34 | 0.34 | 0.34 | 0.34 | 0.37 |
| 1986 | 0.51 | 0.38 | 0.34 | 0.34 | 0.34 | 0.35 | 0.37 |
| 1987 | 0.51 | 0.38 | 0.34 | 0.34 | 0.34 | 0.35 | 0.37 |
| 1988 | 0.51 | 0.38 | 0.34 | 0.34 | 0.34 | 0.34 | 0.37 |
| 1989 | 0.52 | 0.39 | 0.35 | 0.34 | 0.35 | 0.36 | 0.37 |
| 1990 | 0.53 | 0.39 | 0.36 | 0.35 | 0.35 | 0.37 | 0.38 |
| 1991 | 0.55 | 0.40 | 0.36 | 0.35 | 0.36 | 0.37 | 0.39 |
| 1992 | 0.55 | 0.40 | 0.37 | 0.36 | 0.36 | 0.38 | 0.40 |
| 1993 | 0.55 | 0.41 | 0.37 | 0.36 | 0.37 | 0.38 | 0.41 |
| 1994 | 0.55 | 0.41 | 0.38 | 0.37 | 0.37 | 0.39 | 0.43 |
| 1995 | 0.54 | 0.40 | 0.37 | 0.36 | 0.36 | 0.38 | 0.41 |
| 1996 | 0.54 | 0.40 | 0.37 | 0.36 | 0.36 | 0.38 | 0.41 |
| 1997 | 0.53 | 0.40 | 0.37 | 0.36 | 0.36 | 0.38 | 0.41 |
| 1998 | 0.53 | 0.39 | 0.37 | 0.36 | 0.36 | 0.38 | 0.42 |
| 1999 | 0.54 | 0.40 | 0.38 | 0.37 | 0.37 | 0.39 | 0.43 |
| 2000 | 0.54 | 0.40 | 0.38 | 0.38 | 0.37 | 0.39 | 0.43 |
| 2001 | 0.56 | 0.41 | 0.39 | 0.39 | 0.38 | 0.40 | 0.44 |
| 2002 | 0.59 | 0.42 | 0.41 | 0.40 | 0.40 | 0.42 | 0.46 |
| 2003 | 0.60 | 0.42 | 0.41 | 0.40 | 0.40 | 0.42 | 0.46 |
| 2004 | 0.59 | 0.41 | 0.40 | 0.39 | 0.39 | 0.41 | 0.44 |
SOURCE: Author's calculations using Continuous Work History Sample data.
NOTE: CPI = Consumer Price Index.
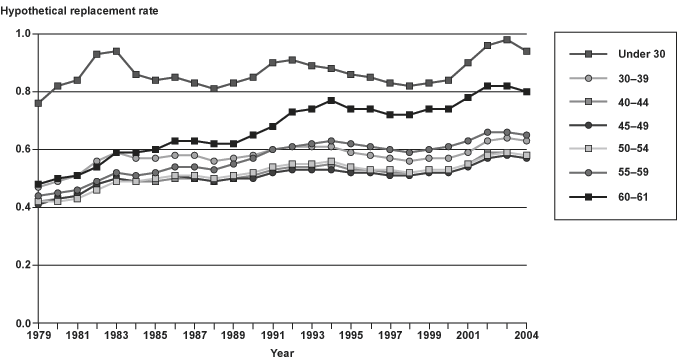
Chart A-12.
Seventy-fifth percentile hypothetical replacement rates for disability-insured workers based on last year of nonzero earnings (indexed to CPI), by age group, 1979–2004 (see Chart 9)
Seventy-fifth percentile hypothetical replacement rates for disability-insured workers based on last year of nonzero earnings (indexed to CPI), by age group, 1979–2004 (see Chart 9)
Show as table
| Year | Under 30 | 30–39 | 40–44 | 45–49 | 50–54 | 55–59 | 60–61 |
|---|---|---|---|---|---|---|---|
| 1979 | 0.76 | 0.47 | 0.42 | 0.41 | 0.42 | 0.44 | 0.48 |
| 1980 | 0.82 | 0.49 | 0.43 | 0.43 | 0.42 | 0.45 | 0.50 |
| 1981 | 0.84 | 0.51 | 0.44 | 0.44 | 0.43 | 0.46 | 0.51 |
| 1982 | 0.93 | 0.56 | 0.48 | 0.48 | 0.46 | 0.49 | 0.54 |
| 1983 | 0.94 | 0.59 | 0.50 | 0.50 | 0.49 | 0.52 | 0.59 |
| 1984 | 0.86 | 0.57 | 0.49 | 0.49 | 0.49 | 0.51 | 0.59 |
| 1985 | 0.84 | 0.57 | 0.49 | 0.50 | 0.50 | 0.52 | 0.60 |
| 1986 | 0.85 | 0.58 | 0.50 | 0.51 | 0.51 | 0.54 | 0.63 |
| 1987 | 0.83 | 0.58 | 0.50 | 0.50 | 0.51 | 0.54 | 0.63 |
| 1988 | 0.81 | 0.56 | 0.49 | 0.49 | 0.50 | 0.53 | 0.62 |
| 1989 | 0.83 | 0.57 | 0.50 | 0.50 | 0.51 | 0.55 | 0.62 |
| 1990 | 0.85 | 0.58 | 0.51 | 0.50 | 0.52 | 0.57 | 0.65 |
| 1991 | 0.90 | 0.60 | 0.53 | 0.52 | 0.54 | 0.60 | 0.68 |
| 1992 | 0.91 | 0.61 | 0.54 | 0.53 | 0.55 | 0.61 | 0.73 |
| 1993 | 0.89 | 0.61 | 0.54 | 0.53 | 0.55 | 0.62 | 0.74 |
| 1994 | 0.88 | 0.61 | 0.55 | 0.53 | 0.56 | 0.63 | 0.77 |
| 1995 | 0.86 | 0.59 | 0.53 | 0.52 | 0.54 | 0.62 | 0.74 |
| 1996 | 0.85 | 0.58 | 0.53 | 0.52 | 0.53 | 0.61 | 0.74 |
| 1997 | 0.83 | 0.57 | 0.52 | 0.51 | 0.53 | 0.60 | 0.72 |
| 1998 | 0.82 | 0.56 | 0.52 | 0.51 | 0.52 | 0.59 | 0.72 |
| 1999 | 0.83 | 0.57 | 0.53 | 0.52 | 0.53 | 0.60 | 0.74 |
| 2000 | 0.84 | 0.57 | 0.53 | 0.52 | 0.53 | 0.61 | 0.74 |
| 2001 | 0.90 | 0.59 | 0.55 | 0.54 | 0.55 | 0.63 | 0.78 |
| 2002 | 0.96 | 0.63 | 0.59 | 0.57 | 0.58 | 0.66 | 0.82 |
| 2003 | 0.98 | 0.64 | 0.59 | 0.58 | 0.59 | 0.66 | 0.82 |
| 2004 | 0.94 | 0.63 | 0.58 | 0.57 | 0.58 | 0.65 | 0.80 |
SOURCE: Author's calculations using Continuous Work History Sample data.
NOTE: CPI = Consumer Price Index.
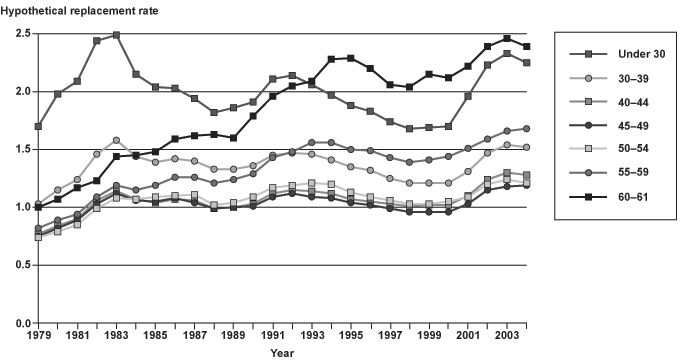
Chart A-13.
Ninetieth percentile hypothetical replacement rates for disability-insured workers based on last year of nonzero earnings (indexed to CPI), by age group, 1979–2004 (see Chart 9)
Ninetieth percentile hypothetical replacement rates for disability-insured workers based on last year of nonzero earnings (indexed to CPI), by age group, 1979–2004 (see Chart 9)
Show as table
| Year | Under 30 | 30–39 | 40–44 | 45–49 | 50–54 | 55–59 | 60–61 |
|---|---|---|---|---|---|---|---|
| 1979 | 1.70 | 1.03 | 0.77 | 0.75 | 0.74 | 0.82 | 1.00 |
| 1980 | 1.98 | 1.15 | 0.84 | 0.82 | 0.79 | 0.89 | 1.07 |
| 1981 | 2.09 | 1.24 | 0.90 | 0.89 | 0.85 | 0.94 | 1.17 |
| 1982 | 2.44 | 1.46 | 1.06 | 1.03 | 0.99 | 1.09 | 1.23 |
| 1983 | 2.49 | 1.58 | 1.14 | 1.12 | 1.08 | 1.19 | 1.44 |
| 1984 | 2.15 | 1.44 | 1.07 | 1.06 | 1.07 | 1.15 | 1.45 |
| 1985 | 2.04 | 1.39 | 1.04 | 1.05 | 1.09 | 1.19 | 1.48 |
| 1986 | 2.03 | 1.42 | 1.07 | 1.08 | 1.10 | 1.26 | 1.59 |
| 1987 | 1.94 | 1.40 | 1.06 | 1.04 | 1.11 | 1.26 | 1.62 |
| 1988 | 1.82 | 1.33 | 0.99 | 0.99 | 1.02 | 1.21 | 1.63 |
| 1989 | 1.86 | 1.33 | 1.00 | 1.00 | 1.04 | 1.24 | 1.60 |
| 1990 | 1.91 | 1.36 | 1.03 | 1.01 | 1.09 | 1.29 | 1.79 |
| 1991 | 2.11 | 1.45 | 1.12 | 1.09 | 1.17 | 1.43 | 1.96 |
| 1992 | 2.14 | 1.47 | 1.15 | 1.12 | 1.19 | 1.48 | 2.05 |
| 1993 | 2.06 | 1.46 | 1.14 | 1.09 | 1.21 | 1.56 | 2.09 |
| 1994 | 1.97 | 1.41 | 1.12 | 1.08 | 1.20 | 1.56 | 2.28 |
| 1995 | 1.88 | 1.35 | 1.07 | 1.04 | 1.13 | 1.50 | 2.29 |
| 1996 | 1.83 | 1.32 | 1.05 | 1.02 | 1.09 | 1.49 | 2.20 |
| 1997 | 1.74 | 1.25 | 1.03 | 0.99 | 1.06 | 1.43 | 2.06 |
| 1998 | 1.68 | 1.21 | 1.01 | 0.96 | 1.03 | 1.39 | 2.04 |
| 1999 | 1.69 | 1.21 | 1.02 | 0.96 | 1.03 | 1.41 | 2.15 |
| 2000 | 1.70 | 1.21 | 1.02 | 0.96 | 1.05 | 1.44 | 2.12 |
| 2001 | 1.96 | 1.31 | 1.10 | 1.03 | 1.09 | 1.51 | 2.22 |
| 2002 | 2.23 | 1.47 | 1.24 | 1.15 | 1.20 | 1.59 | 2.39 |
| 2003 | 2.33 | 1.54 | 1.30 | 1.18 | 1.24 | 1.66 | 2.46 |
| 2004 | 2.25 | 1.52 | 1.28 | 1.19 | 1.21 | 1.68 | 2.39 |
SOURCE: Author's calculations using Continuous Work History Sample data.
NOTE: CPI = Consumer Price Index.
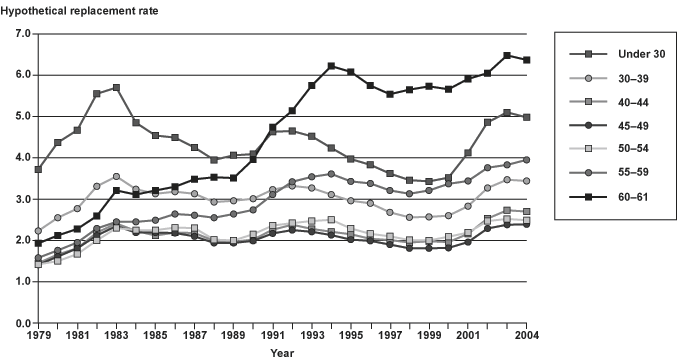
Chart A-14.
Ninety-fifth percentile hypothetical replacement rates for disability-insured workers based on last year of nonzero earnings (indexed to CPI), by age group, 1979–2004 (see Chart 9)
Ninety-fifth percentile hypothetical replacement rates for disability-insured workers based on last year of nonzero earnings (indexed to CPI), by age group, 1979–2004 (see Chart 9)
Show as table
| Year | Under 30 | 30–39 | 40–44 | 45–49 | 50–54 | 55–59 | 60–61 |
|---|---|---|---|---|---|---|---|
| 1979 | 3.72 | 2.23 | 1.45 | 1.41 | 1.42 | 1.58 | 1.93 |
| 1980 | 4.37 | 2.55 | 1.66 | 1.61 | 1.50 | 1.76 | 2.12 |
| 1981 | 4.67 | 2.77 | 1.81 | 1.81 | 1.67 | 1.95 | 2.28 |
| 1982 | 5.55 | 3.31 | 2.19 | 2.12 | 2.00 | 2.29 | 2.59 |
| 1983 | 5.70 | 3.55 | 2.41 | 2.35 | 2.30 | 2.45 | 3.21 |
| 1984 | 4.85 | 3.24 | 2.23 | 2.19 | 2.25 | 2.45 | 3.11 |
| 1985 | 4.54 | 3.13 | 2.12 | 2.19 | 2.25 | 2.49 | 3.21 |
| 1986 | 4.49 | 3.18 | 2.19 | 2.18 | 2.31 | 2.64 | 3.30 |
| 1987 | 4.25 | 3.13 | 2.18 | 2.10 | 2.30 | 2.61 | 3.48 |
| 1988 | 3.95 | 2.93 | 1.99 | 1.94 | 2.02 | 2.55 | 3.53 |
| 1989 | 4.06 | 2.96 | 1.97 | 1.94 | 2.00 | 2.64 | 3.51 |
| 1990 | 4.09 | 3.01 | 2.02 | 1.99 | 2.15 | 2.74 | 3.96 |
| 1991 | 4.63 | 3.23 | 2.26 | 2.17 | 2.36 | 3.11 | 4.74 |
| 1992 | 4.65 | 3.32 | 2.38 | 2.25 | 2.42 | 3.42 | 5.14 |
| 1993 | 4.52 | 3.27 | 2.28 | 2.21 | 2.47 | 3.54 | 5.75 |
| 1994 | 4.24 | 3.11 | 2.21 | 2.13 | 2.50 | 3.61 | 6.22 |
| 1995 | 3.97 | 2.96 | 2.15 | 2.02 | 2.29 | 3.43 | 6.08 |
| 1996 | 3.83 | 2.90 | 2.04 | 1.99 | 2.16 | 3.38 | 5.75 |
| 1997 | 3.62 | 2.68 | 2.01 | 1.90 | 2.10 | 3.21 | 5.54 |
| 1998 | 3.46 | 2.56 | 1.95 | 1.81 | 2.01 | 3.13 | 5.65 |
| 1999 | 3.43 | 2.57 | 1.98 | 1.81 | 2.00 | 3.21 | 5.73 |
| 2000 | 3.52 | 2.60 | 1.96 | 1.82 | 2.09 | 3.37 | 5.66 |
| 2001 | 4.12 | 2.83 | 2.16 | 1.96 | 2.19 | 3.44 | 5.91 |
| 2002 | 4.86 | 3.27 | 2.53 | 2.29 | 2.47 | 3.76 | 6.05 |
| 2003 | 5.10 | 3.47 | 2.73 | 2.38 | 2.52 | 3.83 | 6.48 |
| 2004 | 4.98 | 3.44 | 2.70 | 2.39 | 2.49 | 3.95 | 6.37 |
SOURCE: Author's calculations using Continuous Work History Sample data.
NOTE: CPI = Consumer Price Index.
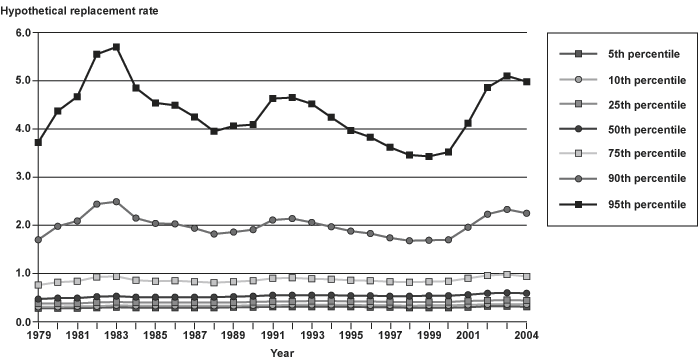
Chart A-15.
Hypothetical replacement rates for disability-insured workers based on last year of nonzero earnings (indexed to CPI) for individuals under age 30, by replacement rate percentile, 1979–2004 (see Chart 9)
Hypothetical replacement rates for disability-insured workers based on last year of nonzero earnings (indexed to CPI) for individuals under age 30, by replacement rate percentile, 1979–2004 (see Chart 9)
Show as table
| Year | 5th percentile |
10th percentile |
25th percentile |
50th percentile |
75th percentile |
90th percentile |
95th percentile |
|---|---|---|---|---|---|---|---|
| 1979 | 0.28 | 0.31 | 0.38 | 0.47 | 0.76 | 1.70 | 3.72 |
| 1980 | 0.28 | 0.31 | 0.38 | 0.49 | 0.82 | 1.98 | 4.37 |
| 1981 | 0.28 | 0.32 | 0.38 | 0.49 | 0.84 | 2.09 | 4.67 |
| 1982 | 0.29 | 0.32 | 0.40 | 0.52 | 0.93 | 2.44 | 5.55 |
| 1983 | 0.30 | 0.34 | 0.41 | 0.53 | 0.94 | 2.49 | 5.70 |
| 1984 | 0.29 | 0.33 | 0.40 | 0.51 | 0.86 | 2.15 | 4.85 |
| 1985 | 0.29 | 0.33 | 0.40 | 0.51 | 0.84 | 2.04 | 4.54 |
| 1986 | 0.29 | 0.33 | 0.40 | 0.51 | 0.85 | 2.03 | 4.49 |
| 1987 | 0.29 | 0.33 | 0.40 | 0.51 | 0.83 | 1.94 | 4.25 |
| 1988 | 0.29 | 0.33 | 0.40 | 0.51 | 0.81 | 1.82 | 3.95 |
| 1989 | 0.30 | 0.33 | 0.40 | 0.52 | 0.83 | 1.86 | 4.06 |
| 1990 | 0.30 | 0.34 | 0.41 | 0.53 | 0.85 | 1.91 | 4.09 |
| 1991 | 0.31 | 0.34 | 0.42 | 0.55 | 0.90 | 2.11 | 4.63 |
| 1992 | 0.31 | 0.35 | 0.42 | 0.55 | 0.91 | 2.14 | 4.65 |
| 1993 | 0.31 | 0.35 | 0.43 | 0.55 | 0.89 | 2.06 | 4.52 |
| 1994 | 0.31 | 0.35 | 0.43 | 0.55 | 0.88 | 1.97 | 4.24 |
| 1995 | 0.31 | 0.35 | 0.42 | 0.54 | 0.86 | 1.88 | 3.97 |
| 1996 | 0.30 | 0.34 | 0.42 | 0.54 | 0.85 | 1.83 | 3.83 |
| 1997 | 0.30 | 0.34 | 0.41 | 0.53 | 0.83 | 1.74 | 3.62 |
| 1998 | 0.29 | 0.33 | 0.41 | 0.53 | 0.82 | 1.68 | 3.46 |
| 1999 | 0.29 | 0.34 | 0.41 | 0.54 | 0.83 | 1.69 | 3.43 |
| 2000 | 0.29 | 0.34 | 0.41 | 0.54 | 0.84 | 1.70 | 3.52 |
| 2001 | 0.30 | 0.35 | 0.43 | 0.56 | 0.90 | 1.96 | 4.12 |
| 2002 | 0.32 | 0.36 | 0.44 | 0.59 | 0.96 | 2.23 | 4.86 |
| 2003 | 0.32 | 0.36 | 0.45 | 0.60 | 0.98 | 2.33 | 5.10 |
| 2004 | 0.31 | 0.36 | 0.44 | 0.59 | 0.94 | 2.25 | 4.98 |
SOURCE: Author's calculations using Continuous Work History Sample data.
NOTE: CPI = Consumer Price Index.
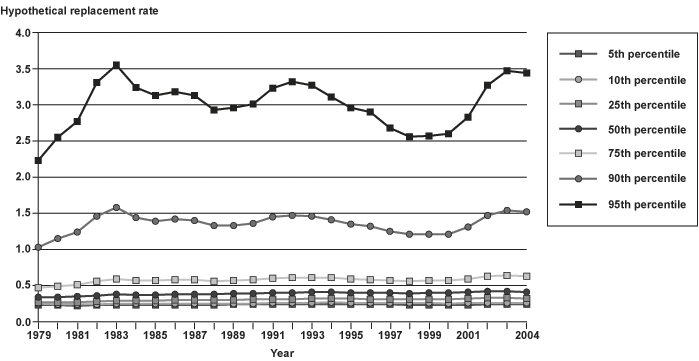
Chart A-16.
Hypothetical replacement rates for disability-insured workers based on last year of nonzero earnings (indexed to CPI) for individuals aged 30–39, by replacement rate percentile, 1979–2004 (see Chart 9)
Hypothetical replacement rates for disability-insured workers based on last year of nonzero earnings (indexed to CPI) for individuals aged 30–39, by replacement rate percentile, 1979–2004 (see Chart 9)
Show as table
| Year | 5th percentile |
10th percentile |
25th percentile |
50th percentile |
75th percentile |
90th percentile |
95th percentile |
|---|---|---|---|---|---|---|---|
| 1979 | 0.23 | 0.25 | 0.27 | 0.34 | 0.47 | 1.03 | 2.23 |
| 1980 | 0.23 | 0.24 | 0.27 | 0.34 | 0.49 | 1.15 | 2.55 |
| 1981 | 0.22 | 0.24 | 0.27 | 0.35 | 0.51 | 1.24 | 2.77 |
| 1982 | 0.23 | 0.24 | 0.28 | 0.36 | 0.56 | 1.46 | 3.31 |
| 1983 | 0.23 | 0.25 | 0.29 | 0.38 | 0.59 | 1.58 | 3.55 |
| 1984 | 0.23 | 0.25 | 0.29 | 0.37 | 0.57 | 1.44 | 3.24 |
| 1985 | 0.23 | 0.25 | 0.29 | 0.37 | 0.57 | 1.39 | 3.13 |
| 1986 | 0.23 | 0.25 | 0.30 | 0.38 | 0.58 | 1.42 | 3.18 |
| 1987 | 0.23 | 0.25 | 0.30 | 0.38 | 0.58 | 1.40 | 3.13 |
| 1988 | 0.23 | 0.25 | 0.30 | 0.38 | 0.56 | 1.33 | 2.93 |
| 1989 | 0.24 | 0.25 | 0.30 | 0.39 | 0.57 | 1.33 | 2.96 |
| 1990 | 0.24 | 0.25 | 0.31 | 0.39 | 0.58 | 1.36 | 3.01 |
| 1991 | 0.24 | 0.26 | 0.31 | 0.40 | 0.60 | 1.45 | 3.23 |
| 1992 | 0.24 | 0.26 | 0.31 | 0.40 | 0.61 | 1.47 | 3.32 |
| 1993 | 0.24 | 0.26 | 0.32 | 0.41 | 0.61 | 1.46 | 3.27 |
| 1994 | 0.24 | 0.27 | 0.32 | 0.41 | 0.61 | 1.41 | 3.11 |
| 1995 | 0.24 | 0.26 | 0.32 | 0.40 | 0.59 | 1.35 | 2.96 |
| 1996 | 0.24 | 0.26 | 0.31 | 0.40 | 0.58 | 1.32 | 2.90 |
| 1997 | 0.24 | 0.26 | 0.31 | 0.40 | 0.57 | 1.25 | 2.68 |
| 1998 | 0.23 | 0.26 | 0.31 | 0.39 | 0.56 | 1.21 | 2.56 |
| 1999 | 0.23 | 0.26 | 0.31 | 0.40 | 0.57 | 1.21 | 2.57 |
| 2000 | 0.23 | 0.25 | 0.31 | 0.40 | 0.57 | 1.21 | 2.60 |
| 2001 | 0.23 | 0.26 | 0.32 | 0.41 | 0.59 | 1.31 | 2.83 |
| 2002 | 0.24 | 0.26 | 0.33 | 0.42 | 0.63 | 1.47 | 3.27 |
| 2003 | 0.24 | 0.26 | 0.33 | 0.42 | 0.64 | 1.54 | 3.47 |
| 2004 | 0.24 | 0.26 | 0.32 | 0.41 | 0.63 | 1.52 | 3.44 |
SOURCE: Author's calculations using Continuous Work History Sample data.
NOTE: CPI = Consumer Price Index.
Chart A-17.
Hypothetical replacement rates for disability-insured workers based on last year of nonzero earnings (indexed to CPI) for individuals aged 40–44, by replacement rate percentile, 1979–2004 (see Chart 9)
Hypothetical replacement rates for disability-insured workers based on last year of nonzero earnings (indexed to CPI) for individuals aged 40–44, by replacement rate percentile, 1979–2004 (see Chart 9)
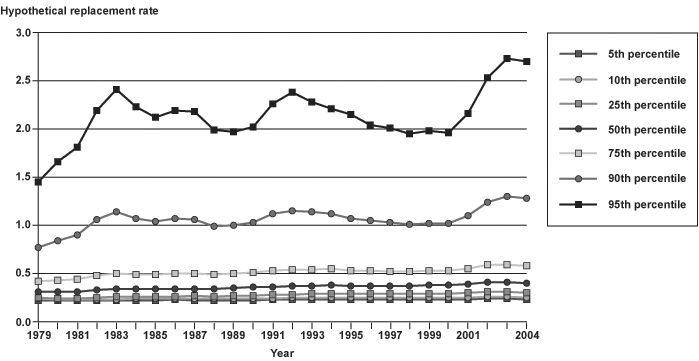
Show as table
| Year | 5th percentile |
10th percentile |
25th percentile |
50th percentile |
75th percentile |
90th percentile |
95th percentile |
|---|---|---|---|---|---|---|---|
| 1979 | 0.22 | 0.24 | 0.25 | 0.31 | 0.42 | 0.77 | 1.45 |
| 1980 | 0.22 | 0.23 | 0.24 | 0.31 | 0.43 | 0.84 | 1.66 |
| 1981 | 0.22 | 0.23 | 0.24 | 0.31 | 0.44 | 0.90 | 1.81 |
| 1982 | 0.22 | 0.23 | 0.25 | 0.33 | 0.48 | 1.06 | 2.19 |
| 1983 | 0.22 | 0.23 | 0.26 | 0.34 | 0.50 | 1.14 | 2.41 |
| 1984 | 0.22 | 0.24 | 0.26 | 0.34 | 0.49 | 1.07 | 2.23 |
| 1985 | 0.22 | 0.24 | 0.26 | 0.34 | 0.49 | 1.04 | 2.12 |
| 1986 | 0.23 | 0.24 | 0.26 | 0.34 | 0.50 | 1.07 | 2.19 |
| 1987 | 0.22 | 0.24 | 0.27 | 0.34 | 0.50 | 1.06 | 2.18 |
| 1988 | 0.22 | 0.24 | 0.26 | 0.34 | 0.49 | 0.99 | 1.99 |
| 1989 | 0.22 | 0.24 | 0.27 | 0.35 | 0.50 | 1.00 | 1.97 |
| 1990 | 0.22 | 0.24 | 0.27 | 0.36 | 0.51 | 1.03 | 2.02 |
| 1991 | 0.23 | 0.24 | 0.28 | 0.36 | 0.53 | 1.12 | 2.26 |
| 1992 | 0.23 | 0.25 | 0.28 | 0.37 | 0.54 | 1.15 | 2.38 |
| 1993 | 0.23 | 0.25 | 0.29 | 0.37 | 0.54 | 1.14 | 2.28 |
| 1994 | 0.23 | 0.25 | 0.29 | 0.38 | 0.55 | 1.12 | 2.21 |
| 1995 | 0.23 | 0.25 | 0.29 | 0.37 | 0.53 | 1.07 | 2.15 |
| 1996 | 0.23 | 0.25 | 0.29 | 0.37 | 0.53 | 1.05 | 2.04 |
| 1997 | 0.23 | 0.25 | 0.29 | 0.37 | 0.52 | 1.03 | 2.01 |
| 1998 | 0.23 | 0.25 | 0.29 | 0.37 | 0.52 | 1.01 | 1.95 |
| 1999 | 0.23 | 0.25 | 0.29 | 0.38 | 0.53 | 1.02 | 1.98 |
| 2000 | 0.23 | 0.25 | 0.29 | 0.38 | 0.53 | 1.02 | 1.96 |
| 2001 | 0.23 | 0.25 | 0.30 | 0.39 | 0.55 | 1.10 | 2.16 |
| 2002 | 0.24 | 0.26 | 0.31 | 0.41 | 0.59 | 1.24 | 2.53 |
| 2003 | 0.24 | 0.26 | 0.31 | 0.41 | 0.59 | 1.30 | 2.73 |
| 2004 | 0.23 | 0.25 | 0.30 | 0.40 | 0.58 | 1.28 | 2.70 |
SOURCE: Author's calculations using Continuous Work History Sample data.
NOTE: CPI = Consumer Price Index.
Chart A-18.
Hypothetical replacement rates for disability-insured workers based on last year of nonzero earnings (indexed to CPI) for individuals aged 45–49, by replacement rate percentile, 1979–2004 (see Chart 9)
Hypothetical replacement rates for disability-insured workers based on last year of nonzero earnings (indexed to CPI) for individuals aged 45–49, by replacement rate percentile, 1979–2004 (see Chart 9)
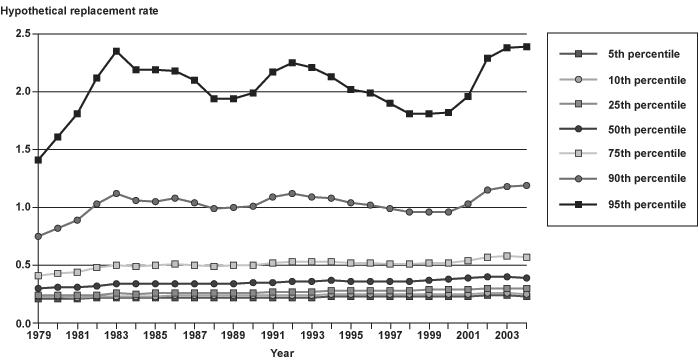
Show as table
| Year | 5th percentile |
10th percentile |
25th percentile |
50th percentile |
75th percentile |
90th percentile |
95th percentile |
|---|---|---|---|---|---|---|---|
| 1979 | 0.21 | 0.23 | 0.24 | 0.30 | 0.41 | 0.75 | 1.41 |
| 1980 | 0.21 | 0.23 | 0.24 | 0.31 | 0.43 | 0.82 | 1.61 |
| 1981 | 0.21 | 0.22 | 0.24 | 0.31 | 0.44 | 0.89 | 1.81 |
| 1982 | 0.22 | 0.23 | 0.24 | 0.32 | 0.48 | 1.03 | 2.12 |
| 1983 | 0.22 | 0.23 | 0.26 | 0.34 | 0.50 | 1.12 | 2.35 |
| 1984 | 0.22 | 0.23 | 0.25 | 0.34 | 0.49 | 1.06 | 2.19 |
| 1985 | 0.22 | 0.23 | 0.26 | 0.34 | 0.50 | 1.05 | 2.19 |
| 1986 | 0.22 | 0.24 | 0.26 | 0.34 | 0.51 | 1.08 | 2.18 |
| 1987 | 0.22 | 0.24 | 0.26 | 0.34 | 0.50 | 1.04 | 2.10 |
| 1988 | 0.22 | 0.24 | 0.26 | 0.34 | 0.49 | 0.99 | 1.94 |
| 1989 | 0.22 | 0.24 | 0.26 | 0.34 | 0.50 | 1.00 | 1.94 |
| 1990 | 0.22 | 0.24 | 0.26 | 0.35 | 0.50 | 1.01 | 1.99 |
| 1991 | 0.22 | 0.24 | 0.27 | 0.35 | 0.52 | 1.09 | 2.17 |
| 1992 | 0.22 | 0.24 | 0.27 | 0.36 | 0.53 | 1.12 | 2.25 |
| 1993 | 0.22 | 0.24 | 0.27 | 0.36 | 0.53 | 1.09 | 2.21 |
| 1994 | 0.23 | 0.25 | 0.28 | 0.37 | 0.53 | 1.08 | 2.13 |
| 1995 | 0.23 | 0.25 | 0.28 | 0.36 | 0.52 | 1.04 | 2.02 |
| 1996 | 0.23 | 0.25 | 0.28 | 0.36 | 0.52 | 1.02 | 1.99 |
| 1997 | 0.23 | 0.25 | 0.28 | 0.36 | 0.51 | 0.99 | 1.90 |
| 1998 | 0.23 | 0.25 | 0.28 | 0.36 | 0.51 | 0.96 | 1.81 |
| 1999 | 0.23 | 0.25 | 0.29 | 0.37 | 0.52 | 0.96 | 1.81 |
| 2000 | 0.23 | 0.25 | 0.29 | 0.38 | 0.52 | 0.96 | 1.82 |
| 2001 | 0.23 | 0.25 | 0.29 | 0.39 | 0.54 | 1.03 | 1.96 |
| 2002 | 0.24 | 0.26 | 0.30 | 0.40 | 0.57 | 1.15 | 2.29 |
| 2003 | 0.24 | 0.26 | 0.30 | 0.40 | 0.58 | 1.18 | 2.38 |
| 2004 | 0.23 | 0.25 | 0.30 | 0.39 | 0.57 | 1.19 | 2.39 |
SOURCE: Author's calculations using Continuous Work History Sample data.
NOTE: CPI = Consumer Price Index.
Chart A-19.
Hypothetical replacement rates for disability-insured workers based on last year of nonzero earnings (indexed to CPI) for individuals aged 50–54, by replacement rate percentile, 1979–2004 (see Chart 9)
Hypothetical replacement rates for disability-insured workers based on last year of nonzero earnings (indexed to CPI) for individuals aged 50–54, by replacement rate percentile, 1979–2004 (see Chart 9)
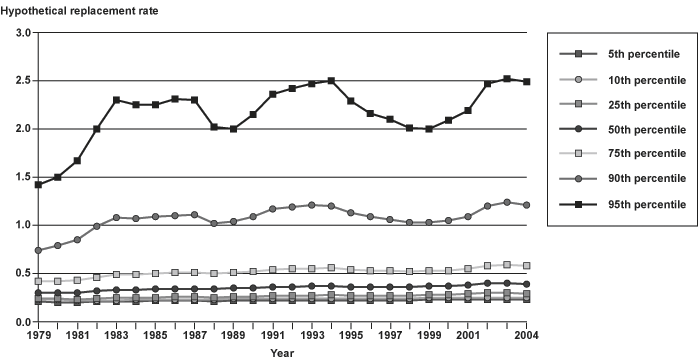
Show as table
| Year | 5th percentile |
10th percentile |
25th percentile |
50th percentile |
75th percentile |
90th percentile |
95th percentile |
|---|---|---|---|---|---|---|---|
| 1979 | 0.21 | 0.23 | 0.24 | 0.30 | 0.42 | 0.74 | 1.42 |
| 1980 | 0.20 | 0.23 | 0.24 | 0.30 | 0.42 | 0.79 | 1.50 |
| 1981 | 0.20 | 0.22 | 0.23 | 0.30 | 0.43 | 0.85 | 1.67 |
| 1982 | 0.21 | 0.22 | 0.24 | 0.32 | 0.46 | 0.99 | 2.00 |
| 1983 | 0.21 | 0.22 | 0.25 | 0.33 | 0.49 | 1.08 | 2.30 |
| 1984 | 0.21 | 0.23 | 0.25 | 0.33 | 0.49 | 1.07 | 2.25 |
| 1985 | 0.22 | 0.23 | 0.25 | 0.34 | 0.50 | 1.09 | 2.25 |
| 1986 | 0.22 | 0.23 | 0.26 | 0.34 | 0.51 | 1.10 | 2.31 |
| 1987 | 0.22 | 0.23 | 0.26 | 0.34 | 0.51 | 1.11 | 2.30 |
| 1988 | 0.21 | 0.23 | 0.25 | 0.34 | 0.50 | 1.02 | 2.02 |
| 1989 | 0.22 | 0.24 | 0.26 | 0.35 | 0.51 | 1.04 | 2.00 |
| 1990 | 0.22 | 0.24 | 0.26 | 0.35 | 0.52 | 1.09 | 2.15 |
| 1991 | 0.22 | 0.24 | 0.27 | 0.36 | 0.54 | 1.17 | 2.36 |
| 1992 | 0.22 | 0.24 | 0.27 | 0.36 | 0.55 | 1.19 | 2.42 |
| 1993 | 0.22 | 0.24 | 0.27 | 0.37 | 0.55 | 1.21 | 2.47 |
| 1994 | 0.22 | 0.24 | 0.28 | 0.37 | 0.56 | 1.20 | 2.50 |
| 1995 | 0.22 | 0.24 | 0.27 | 0.36 | 0.54 | 1.13 | 2.29 |
| 1996 | 0.22 | 0.24 | 0.27 | 0.36 | 0.53 | 1.09 | 2.16 |
| 1997 | 0.22 | 0.24 | 0.27 | 0.36 | 0.53 | 1.06 | 2.10 |
| 1998 | 0.22 | 0.24 | 0.27 | 0.36 | 0.52 | 1.03 | 2.01 |
| 1999 | 0.23 | 0.25 | 0.28 | 0.37 | 0.53 | 1.03 | 2.00 |
| 2000 | 0.23 | 0.25 | 0.28 | 0.37 | 0.53 | 1.05 | 2.09 |
| 2001 | 0.23 | 0.25 | 0.29 | 0.38 | 0.55 | 1.09 | 2.19 |
| 2002 | 0.23 | 0.25 | 0.30 | 0.40 | 0.58 | 1.20 | 2.47 |
| 2003 | 0.23 | 0.25 | 0.30 | 0.40 | 0.59 | 1.24 | 2.52 |
| 2004 | 0.23 | 0.25 | 0.29 | 0.39 | 0.58 | 1.21 | 2.49 |
SOURCE: Author's calculations using Continuous Work History Sample data.
NOTE: CPI = Consumer Price Index.
Chart A-20.
Hypothetical replacement rates for disability-insured workers based on last year of nonzero earnings (indexed to CPI) for individuals aged 55–59, by replacement rate percentile, 1979–2004 (see Chart 9)
Hypothetical replacement rates for disability-insured workers based on last year of nonzero earnings (indexed to CPI) for individuals aged 55–59, by replacement rate percentile, 1979–2004 (see Chart 9)
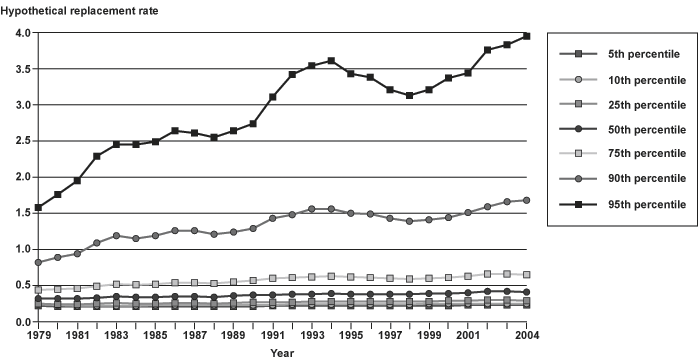
Show as table
| Year | 5th percentile |
10th percentile |
25th percentile |
50th percentile |
75th percentile |
90th percentile |
95th percentile |
|---|---|---|---|---|---|---|---|
| 1979 | 0.22 | 0.24 | 0.25 | 0.32 | 0.44 | 0.82 | 1.58 |
| 1980 | 0.21 | 0.23 | 0.24 | 0.32 | 0.45 | 0.89 | 1.76 |
| 1981 | 0.21 | 0.22 | 0.24 | 0.32 | 0.46 | 0.94 | 1.95 |
| 1982 | 0.21 | 0.22 | 0.25 | 0.33 | 0.49 | 1.09 | 2.29 |
| 1983 | 0.21 | 0.22 | 0.26 | 0.35 | 0.52 | 1.19 | 2.45 |
| 1984 | 0.21 | 0.22 | 0.25 | 0.34 | 0.51 | 1.15 | 2.45 |
| 1985 | 0.21 | 0.23 | 0.25 | 0.34 | 0.52 | 1.19 | 2.49 |
| 1986 | 0.21 | 0.23 | 0.26 | 0.35 | 0.54 | 1.26 | 2.64 |
| 1987 | 0.21 | 0.23 | 0.26 | 0.35 | 0.54 | 1.26 | 2.61 |
| 1988 | 0.21 | 0.23 | 0.25 | 0.34 | 0.53 | 1.21 | 2.55 |
| 1989 | 0.21 | 0.23 | 0.26 | 0.36 | 0.55 | 1.24 | 2.64 |
| 1990 | 0.21 | 0.23 | 0.27 | 0.37 | 0.57 | 1.29 | 2.74 |
| 1991 | 0.22 | 0.23 | 0.27 | 0.37 | 0.60 | 1.43 | 3.11 |
| 1992 | 0.22 | 0.24 | 0.27 | 0.38 | 0.61 | 1.48 | 3.42 |
| 1993 | 0.22 | 0.24 | 0.28 | 0.38 | 0.62 | 1.56 | 3.54 |
| 1994 | 0.22 | 0.24 | 0.28 | 0.39 | 0.63 | 1.56 | 3.61 |
| 1995 | 0.22 | 0.24 | 0.28 | 0.38 | 0.62 | 1.50 | 3.43 |
| 1996 | 0.22 | 0.24 | 0.28 | 0.38 | 0.61 | 1.49 | 3.38 |
| 1997 | 0.22 | 0.24 | 0.28 | 0.38 | 0.60 | 1.43 | 3.21 |
| 1998 | 0.22 | 0.24 | 0.28 | 0.38 | 0.59 | 1.39 | 3.13 |
| 1999 | 0.22 | 0.25 | 0.28 | 0.39 | 0.60 | 1.41 | 3.21 |
| 2000 | 0.22 | 0.25 | 0.29 | 0.39 | 0.61 | 1.44 | 3.37 |
| 2001 | 0.23 | 0.25 | 0.29 | 0.40 | 0.63 | 1.51 | 3.44 |
| 2002 | 0.23 | 0.25 | 0.30 | 0.42 | 0.66 | 1.59 | 3.76 |
| 2003 | 0.23 | 0.25 | 0.30 | 0.42 | 0.66 | 1.66 | 3.83 |
| 2004 | 0.23 | 0.25 | 0.29 | 0.41 | 0.65 | 1.68 | 3.95 |
SOURCE: Author's calculations using Continuous Work History Sample data.
NOTE: CPI = Consumer Price Index.
Chart A-21.
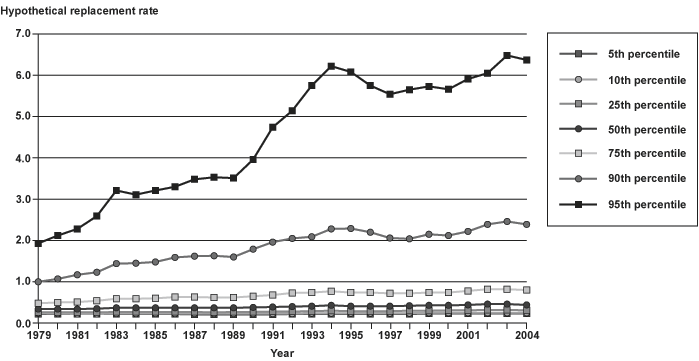
Hypothetical replacement rates for disability-insured workers based on last year of nonzero earnings (indexed to CPI) for individuals aged 60–61, by replacement rate percentile, 1979–2004 (see Chart 9)
Hypothetical replacement rates for disability-insured workers based on last year of nonzero earnings (indexed to CPI) for individuals aged 60–61, by replacement rate percentile, 1979–2004 (see Chart 9)
Show as table
| Year | 5th percentile |
10th percentile |
25th percentile |
50th percentile |
75th percentile |
90th percentile |
95th percentile |
|---|---|---|---|---|---|---|---|
| 1979 | 0.22 | 0.24 | 0.26 | 0.34 | 0.48 | 1.00 | 1.93 |
| 1980 | 0.22 | 0.23 | 0.26 | 0.34 | 0.50 | 1.07 | 2.12 |
| 1981 | 0.22 | 0.22 | 0.26 | 0.34 | 0.51 | 1.17 | 2.28 |
| 1982 | 0.22 | 0.22 | 0.26 | 0.35 | 0.54 | 1.23 | 2.59 |
| 1983 | 0.22 | 0.23 | 0.27 | 0.37 | 0.59 | 1.44 | 3.21 |
| 1984 | 0.22 | 0.23 | 0.27 | 0.37 | 0.59 | 1.45 | 3.11 |
| 1985 | 0.22 | 0.23 | 0.27 | 0.37 | 0.60 | 1.48 | 3.21 |
| 1986 | 0.22 | 0.23 | 0.27 | 0.37 | 0.63 | 1.59 | 3.30 |
| 1987 | 0.21 | 0.23 | 0.27 | 0.37 | 0.63 | 1.62 | 3.48 |
| 1988 | 0.21 | 0.23 | 0.26 | 0.37 | 0.62 | 1.63 | 3.53 |
| 1989 | 0.21 | 0.23 | 0.27 | 0.37 | 0.62 | 1.60 | 3.51 |
| 1990 | 0.21 | 0.23 | 0.27 | 0.38 | 0.65 | 1.79 | 3.96 |
| 1991 | 0.21 | 0.23 | 0.28 | 0.39 | 0.68 | 1.96 | 4.74 |
| 1992 | 0.22 | 0.23 | 0.28 | 0.40 | 0.73 | 2.05 | 5.14 |
| 1993 | 0.22 | 0.24 | 0.29 | 0.41 | 0.74 | 2.09 | 5.75 |
| 1994 | 0.22 | 0.24 | 0.30 | 0.43 | 0.77 | 2.28 | 6.22 |
| 1995 | 0.22 | 0.24 | 0.29 | 0.41 | 0.74 | 2.29 | 6.08 |
| 1996 | 0.22 | 0.24 | 0.29 | 0.41 | 0.74 | 2.20 | 5.75 |
| 1997 | 0.22 | 0.24 | 0.29 | 0.41 | 0.72 | 2.06 | 5.54 |
| 1998 | 0.22 | 0.24 | 0.30 | 0.42 | 0.72 | 2.04 | 5.65 |
| 1999 | 0.23 | 0.25 | 0.30 | 0.43 | 0.74 | 2.15 | 5.73 |
| 2000 | 0.23 | 0.25 | 0.31 | 0.43 | 0.74 | 2.12 | 5.66 |
| 2001 | 0.23 | 0.25 | 0.31 | 0.44 | 0.78 | 2.22 | 5.91 |
| 2002 | 0.23 | 0.25 | 0.32 | 0.46 | 0.82 | 2.39 | 6.05 |
| 2003 | 0.23 | 0.25 | 0.32 | 0.46 | 0.82 | 2.46 | 6.48 |
| 2004 | 0.23 | 0.25 | 0.31 | 0.44 | 0.80 | 2.39 | 6.37 |
SOURCE: Author's calculations using Continuous Work History Sample data.
NOTE: CPI = Consumer Price Index.
Chart A-22.
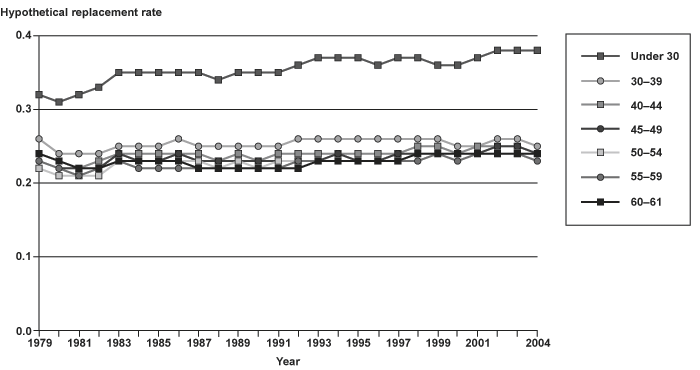
Fifth percentile hypothetical replacement rates for disability-insured workers based on last 3 years' average earnings (indexed to CPI), by age group, 1979–2004 (see Chart 10)
Fifth percentile hypothetical replacement rates for disability-insured workers based on last 3 years' average earnings (indexed to CPI), by age group, 1979–2004 (see Chart 10)
Show as table
| Year | Under 30 | 30–39 | 40–44 | 45–49 | 50–54 | 55–59 | 60–61 |
|---|---|---|---|---|---|---|---|
| 1979 | 0.32 | 0.26 | 0.24 | 0.23 | 0.22 | 0.23 | 0.24 |
| 1980 | 0.31 | 0.24 | 0.23 | 0.22 | 0.21 | 0.22 | 0.23 |
| 1981 | 0.32 | 0.24 | 0.22 | 0.22 | 0.21 | 0.21 | 0.22 |
| 1982 | 0.33 | 0.24 | 0.23 | 0.22 | 0.21 | 0.22 | 0.22 |
| 1983 | 0.35 | 0.25 | 0.24 | 0.24 | 0.23 | 0.23 | 0.23 |
| 1984 | 0.35 | 0.25 | 0.24 | 0.23 | 0.23 | 0.22 | 0.23 |
| 1985 | 0.35 | 0.25 | 0.24 | 0.23 | 0.23 | 0.22 | 0.23 |
| 1986 | 0.35 | 0.26 | 0.24 | 0.24 | 0.23 | 0.22 | 0.23 |
| 1987 | 0.35 | 0.25 | 0.24 | 0.23 | 0.23 | 0.22 | 0.22 |
| 1988 | 0.34 | 0.25 | 0.23 | 0.23 | 0.22 | 0.22 | 0.22 |
| 1989 | 0.35 | 0.25 | 0.24 | 0.23 | 0.23 | 0.22 | 0.22 |
| 1990 | 0.35 | 0.25 | 0.23 | 0.23 | 0.22 | 0.22 | 0.22 |
| 1991 | 0.35 | 0.25 | 0.24 | 0.23 | 0.23 | 0.22 | 0.22 |
| 1992 | 0.36 | 0.26 | 0.24 | 0.23 | 0.23 | 0.23 | 0.22 |
| 1993 | 0.37 | 0.26 | 0.24 | 0.23 | 0.23 | 0.23 | 0.23 |
| 1994 | 0.37 | 0.26 | 0.24 | 0.24 | 0.23 | 0.23 | 0.23 |
| 1995 | 0.37 | 0.26 | 0.24 | 0.23 | 0.23 | 0.23 | 0.23 |
| 1996 | 0.36 | 0.26 | 0.24 | 0.23 | 0.23 | 0.23 | 0.23 |
| 1997 | 0.37 | 0.26 | 0.24 | 0.24 | 0.23 | 0.23 | 0.23 |
| 1998 | 0.37 | 0.26 | 0.25 | 0.24 | 0.24 | 0.23 | 0.24 |
| 1999 | 0.36 | 0.26 | 0.25 | 0.24 | 0.24 | 0.24 | 0.24 |
| 2000 | 0.36 | 0.25 | 0.24 | 0.24 | 0.24 | 0.23 | 0.24 |
| 2001 | 0.37 | 0.25 | 0.25 | 0.24 | 0.24 | 0.24 | 0.24 |
| 2002 | 0.38 | 0.26 | 0.25 | 0.25 | 0.24 | 0.24 | 0.24 |
| 2003 | 0.38 | 0.26 | 0.25 | 0.25 | 0.24 | 0.24 | 0.24 |
| 2004 | 0.38 | 0.25 | 0.24 | 0.24 | 0.24 | 0.23 | 0.24 |
SOURCE: Author's calculations using Continuous Work History Sample data.
NOTE: CPI = Consumer Price Index.
Chart A-23.
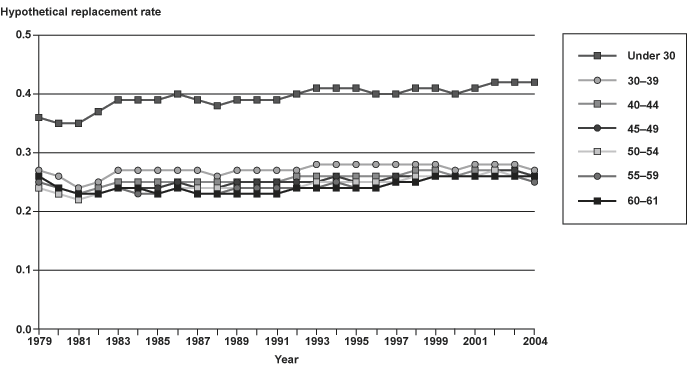
Tenth percentile hypothetical replacement rates for disability-insured workers based on last 3 years' average earnings (indexed to CPI), by age group, 1979–2004 (see Chart 10)
Tenth percentile hypothetical replacement rates for disability-insured workers based on last 3 years' average earnings (indexed to CPI), by age group, 1979–2004 (see Chart 10)
Show as table
| Year | Under 30 | 30–39 | 40–44 | 45–49 | 50–54 | 55–59 | 60–61 |
|---|---|---|---|---|---|---|---|
| 1979 | 0.36 | 0.27 | 0.26 | 0.25 | 0.24 | 0.25 | 0.26 |
| 1980 | 0.35 | 0.26 | 0.24 | 0.24 | 0.23 | 0.24 | 0.24 |
| 1981 | 0.35 | 0.24 | 0.23 | 0.23 | 0.22 | 0.23 | 0.23 |
| 1982 | 0.37 | 0.25 | 0.24 | 0.23 | 0.23 | 0.23 | 0.23 |
| 1983 | 0.39 | 0.27 | 0.25 | 0.24 | 0.24 | 0.24 | 0.24 |
| 1984 | 0.39 | 0.27 | 0.25 | 0.24 | 0.24 | 0.23 | 0.24 |
| 1985 | 0.39 | 0.27 | 0.25 | 0.24 | 0.23 | 0.23 | 0.23 |
| 1986 | 0.40 | 0.27 | 0.25 | 0.25 | 0.24 | 0.24 | 0.24 |
| 1987 | 0.39 | 0.27 | 0.25 | 0.24 | 0.24 | 0.23 | 0.23 |
| 1988 | 0.38 | 0.26 | 0.25 | 0.24 | 0.24 | 0.23 | 0.23 |
| 1989 | 0.39 | 0.27 | 0.25 | 0.25 | 0.24 | 0.24 | 0.23 |
| 1990 | 0.39 | 0.27 | 0.25 | 0.25 | 0.24 | 0.24 | 0.23 |
| 1991 | 0.39 | 0.27 | 0.25 | 0.25 | 0.24 | 0.24 | 0.23 |
| 1992 | 0.40 | 0.27 | 0.26 | 0.25 | 0.24 | 0.24 | 0.24 |
| 1993 | 0.41 | 0.28 | 0.26 | 0.25 | 0.25 | 0.24 | 0.24 |
| 1994 | 0.41 | 0.28 | 0.26 | 0.26 | 0.25 | 0.25 | 0.24 |
| 1995 | 0.41 | 0.28 | 0.26 | 0.25 | 0.25 | 0.24 | 0.24 |
| 1996 | 0.40 | 0.28 | 0.26 | 0.25 | 0.25 | 0.24 | 0.24 |
| 1997 | 0.40 | 0.28 | 0.26 | 0.26 | 0.25 | 0.25 | 0.25 |
| 1998 | 0.41 | 0.28 | 0.27 | 0.26 | 0.26 | 0.25 | 0.25 |
| 1999 | 0.41 | 0.28 | 0.27 | 0.26 | 0.26 | 0.26 | 0.26 |
| 2000 | 0.40 | 0.27 | 0.26 | 0.26 | 0.26 | 0.26 | 0.26 |
| 2001 | 0.41 | 0.28 | 0.27 | 0.26 | 0.26 | 0.26 | 0.26 |
| 2002 | 0.42 | 0.28 | 0.27 | 0.27 | 0.27 | 0.26 | 0.26 |
| 2003 | 0.42 | 0.28 | 0.27 | 0.27 | 0.26 | 0.26 | 0.26 |
| 2004 | 0.42 | 0.27 | 0.26 | 0.26 | 0.26 | 0.25 | 0.26 |
SOURCE: Author's calculations using Continuous Work History Sample data.
NOTE: CPI = Consumer Price Index.
Chart A-24.
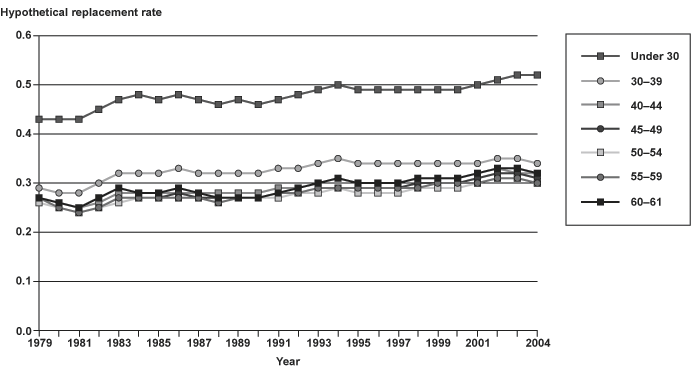
Twenty-fifth percentile hypothetical replacement rates for disability-insured workers based on last 3 years' average earnings (indexed to CPI), by age group, 1979–2004 (see Chart 10)
Twenty-fifth percentile hypothetical replacement rates for disability-insured workers based on last 3 years' average earnings (indexed to CPI), by age group, 1979–2004 (see Chart 10)
Show as table
| Year | Under 30 | 30–39 | 40–44 | 45–49 | 50–54 | 55–59 | 60–61 |
|---|---|---|---|---|---|---|---|
| 1979 | 0.43 | 0.29 | 0.27 | 0.27 | 0.26 | 0.27 | 0.27 |
| 1980 | 0.43 | 0.28 | 0.26 | 0.25 | 0.25 | 0.25 | 0.26 |
| 1981 | 0.43 | 0.28 | 0.25 | 0.24 | 0.24 | 0.24 | 0.25 |
| 1982 | 0.45 | 0.30 | 0.26 | 0.25 | 0.25 | 0.25 | 0.27 |
| 1983 | 0.47 | 0.32 | 0.28 | 0.27 | 0.26 | 0.27 | 0.29 |
| 1984 | 0.48 | 0.32 | 0.28 | 0.27 | 0.27 | 0.27 | 0.28 |
| 1985 | 0.47 | 0.32 | 0.28 | 0.27 | 0.27 | 0.27 | 0.28 |
| 1986 | 0.48 | 0.33 | 0.28 | 0.28 | 0.27 | 0.27 | 0.29 |
| 1987 | 0.47 | 0.32 | 0.28 | 0.27 | 0.27 | 0.27 | 0.28 |
| 1988 | 0.46 | 0.32 | 0.28 | 0.27 | 0.26 | 0.26 | 0.27 |
| 1989 | 0.47 | 0.32 | 0.28 | 0.27 | 0.27 | 0.27 | 0.27 |
| 1990 | 0.46 | 0.32 | 0.28 | 0.27 | 0.27 | 0.27 | 0.27 |
| 1991 | 0.47 | 0.33 | 0.29 | 0.28 | 0.27 | 0.28 | 0.28 |
| 1992 | 0.48 | 0.33 | 0.29 | 0.28 | 0.28 | 0.28 | 0.29 |
| 1993 | 0.49 | 0.34 | 0.30 | 0.28 | 0.28 | 0.29 | 0.30 |
| 1994 | 0.50 | 0.35 | 0.31 | 0.29 | 0.29 | 0.29 | 0.31 |
| 1995 | 0.49 | 0.34 | 0.30 | 0.29 | 0.28 | 0.29 | 0.30 |
| 1996 | 0.49 | 0.34 | 0.30 | 0.29 | 0.28 | 0.29 | 0.30 |
| 1997 | 0.49 | 0.34 | 0.30 | 0.29 | 0.28 | 0.29 | 0.30 |
| 1998 | 0.49 | 0.34 | 0.31 | 0.30 | 0.29 | 0.29 | 0.31 |
| 1999 | 0.49 | 0.34 | 0.31 | 0.30 | 0.29 | 0.30 | 0.31 |
| 2000 | 0.49 | 0.34 | 0.31 | 0.30 | 0.29 | 0.30 | 0.31 |
| 2001 | 0.50 | 0.34 | 0.32 | 0.31 | 0.30 | 0.30 | 0.32 |
| 2002 | 0.51 | 0.35 | 0.33 | 0.32 | 0.31 | 0.31 | 0.33 |
| 2003 | 0.52 | 0.35 | 0.32 | 0.32 | 0.31 | 0.31 | 0.33 |
| 2004 | 0.52 | 0.34 | 0.32 | 0.31 | 0.30 | 0.30 | 0.32 |
SOURCE: Author's calculations using Continuous Work History Sample data.
NOTE: CPI = Consumer Price Index.
Chart A-25.
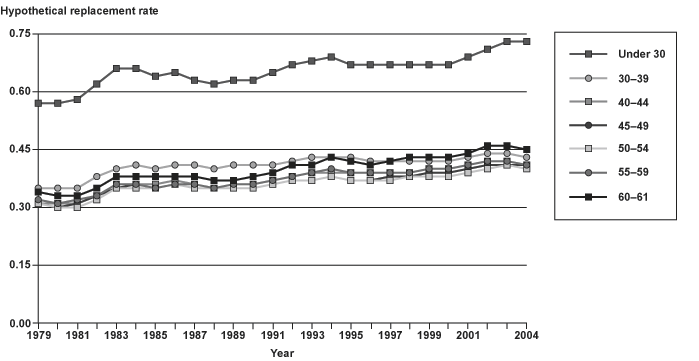
Fiftieth percentile hypothetical replacement rates for disability-insured workers based on last 3 years' average earnings (indexed to CPI), by age group, 1979–2004 (see Chart 10)
Fiftieth percentile hypothetical replacement rates for disability-insured workers based on last 3 years' average earnings (indexed to CPI), by age group, 1979–2004 (see Chart 10)
Show as table
| Year | Under 30 | 30–39 | 40–44 | 45–49 | 50–54 | 55–59 | 60–61 |
|---|---|---|---|---|---|---|---|
| 1979 | 0.57 | 0.35 | 0.31 | 0.31 | 0.31 | 0.32 | 0.34 |
| 1980 | 0.57 | 0.35 | 0.31 | 0.30 | 0.30 | 0.31 | 0.33 |
| 1981 | 0.58 | 0.35 | 0.31 | 0.31 | 0.30 | 0.32 | 0.33 |
| 1982 | 0.62 | 0.38 | 0.33 | 0.33 | 0.32 | 0.33 | 0.35 |
| 1983 | 0.66 | 0.40 | 0.36 | 0.35 | 0.35 | 0.36 | 0.38 |
| 1984 | 0.66 | 0.41 | 0.36 | 0.36 | 0.35 | 0.36 | 0.38 |
| 1985 | 0.64 | 0.40 | 0.36 | 0.35 | 0.35 | 0.35 | 0.38 |
| 1986 | 0.65 | 0.41 | 0.37 | 0.36 | 0.36 | 0.36 | 0.38 |
| 1987 | 0.63 | 0.41 | 0.36 | 0.35 | 0.35 | 0.36 | 0.38 |
| 1988 | 0.62 | 0.40 | 0.35 | 0.35 | 0.35 | 0.35 | 0.37 |
| 1989 | 0.63 | 0.41 | 0.36 | 0.35 | 0.35 | 0.36 | 0.37 |
| 1990 | 0.63 | 0.41 | 0.36 | 0.35 | 0.35 | 0.36 | 0.38 |
| 1991 | 0.65 | 0.41 | 0.37 | 0.36 | 0.36 | 0.37 | 0.39 |
| 1992 | 0.67 | 0.42 | 0.38 | 0.37 | 0.37 | 0.38 | 0.41 |
| 1993 | 0.68 | 0.43 | 0.39 | 0.37 | 0.37 | 0.39 | 0.41 |
| 1994 | 0.69 | 0.43 | 0.39 | 0.38 | 0.38 | 0.40 | 0.43 |
| 1995 | 0.67 | 0.43 | 0.39 | 0.37 | 0.37 | 0.39 | 0.42 |
| 1996 | 0.67 | 0.42 | 0.39 | 0.37 | 0.37 | 0.39 | 0.41 |
| 1997 | 0.67 | 0.42 | 0.39 | 0.38 | 0.37 | 0.39 | 0.42 |
| 1998 | 0.67 | 0.42 | 0.39 | 0.38 | 0.38 | 0.39 | 0.43 |
| 1999 | 0.67 | 0.42 | 0.40 | 0.39 | 0.38 | 0.40 | 0.43 |
| 2000 | 0.67 | 0.42 | 0.40 | 0.39 | 0.38 | 0.40 | 0.43 |
| 2001 | 0.69 | 0.43 | 0.41 | 0.40 | 0.39 | 0.41 | 0.44 |
| 2002 | 0.71 | 0.44 | 0.42 | 0.41 | 0.40 | 0.42 | 0.46 |
| 2003 | 0.73 | 0.44 | 0.42 | 0.41 | 0.41 | 0.42 | 0.46 |
| 2004 | 0.73 | 0.43 | 0.41 | 0.41 | 0.40 | 0.41 | 0.45 |
SOURCE: Author's calculations using Continuous Work History Sample data.
NOTE: CPI = Consumer Price Index.
Chart A-26.
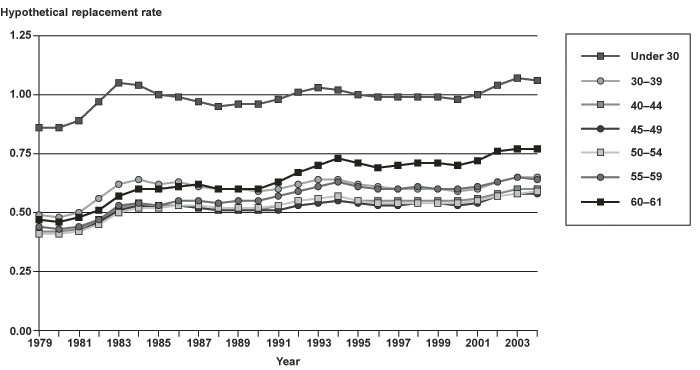
Seventy-fifth percentile hypothetical replacement rates for disability-insured workers based on last 3 years' average earnings (indexed to CPI), by age group, 1979–2004 (see Chart 10)
Seventy-fifth percentile hypothetical replacement rates for disability-insured workers based on last 3 years' average earnings (indexed to CPI), by age group, 1979–2004 (see Chart 10)
Show as table
| Year | Under 30 | 30–39 | 40–44 | 45–49 | 50–54 | 55–59 | 60–61 |
|---|---|---|---|---|---|---|---|
| 1979 | 0.86 | 0.49 | 0.42 | 0.41 | 0.41 | 0.44 | 0.47 |
| 1980 | 0.86 | 0.48 | 0.42 | 0.41 | 0.41 | 0.43 | 0.46 |
| 1981 | 0.89 | 0.50 | 0.43 | 0.42 | 0.42 | 0.44 | 0.48 |
| 1982 | 0.97 | 0.56 | 0.47 | 0.46 | 0.45 | 0.47 | 0.51 |
| 1983 | 1.05 | 0.62 | 0.52 | 0.51 | 0.50 | 0.53 | 0.57 |
| 1984 | 1.04 | 0.64 | 0.54 | 0.53 | 0.52 | 0.54 | 0.60 |
| 1985 | 1.00 | 0.62 | 0.53 | 0.52 | 0.52 | 0.53 | 0.60 |
| 1986 | 0.99 | 0.63 | 0.53 | 0.53 | 0.53 | 0.55 | 0.61 |
| 1987 | 0.97 | 0.61 | 0.52 | 0.52 | 0.53 | 0.55 | 0.62 |
| 1988 | 0.95 | 0.60 | 0.51 | 0.51 | 0.52 | 0.54 | 0.60 |
| 1989 | 0.96 | 0.60 | 0.51 | 0.51 | 0.52 | 0.55 | 0.60 |
| 1990 | 0.96 | 0.59 | 0.51 | 0.51 | 0.52 | 0.55 | 0.60 |
| 1991 | 0.98 | 0.60 | 0.53 | 0.51 | 0.53 | 0.57 | 0.63 |
| 1992 | 1.01 | 0.62 | 0.55 | 0.53 | 0.55 | 0.59 | 0.67 |
| 1993 | 1.03 | 0.64 | 0.56 | 0.54 | 0.56 | 0.61 | 0.70 |
| 1994 | 1.02 | 0.64 | 0.57 | 0.55 | 0.57 | 0.63 | 0.73 |
| 1995 | 1.00 | 0.62 | 0.55 | 0.54 | 0.55 | 0.61 | 0.71 |
| 1996 | 0.99 | 0.61 | 0.55 | 0.53 | 0.54 | 0.60 | 0.69 |
| 1997 | 0.99 | 0.60 | 0.55 | 0.53 | 0.54 | 0.60 | 0.70 |
| 1998 | 0.99 | 0.60 | 0.55 | 0.54 | 0.54 | 0.61 | 0.71 |
| 1999 | 0.99 | 0.60 | 0.55 | 0.54 | 0.54 | 0.60 | 0.71 |
| 2000 | 0.98 | 0.59 | 0.55 | 0.53 | 0.54 | 0.60 | 0.70 |
| 2001 | 1.00 | 0.60 | 0.56 | 0.54 | 0.55 | 0.61 | 0.72 |
| 2002 | 1.04 | 0.63 | 0.58 | 0.57 | 0.57 | 0.63 | 0.76 |
| 2003 | 1.07 | 0.65 | 0.60 | 0.58 | 0.58 | 0.65 | 0.77 |
| 2004 | 1.06 | 0.65 | 0.60 | 0.58 | 0.59 | 0.64 | 0.77 |
SOURCE: Author's calculations using Continuous Work History Sample data.
NOTE: CPI = Consumer Price Index.
Chart A-27.
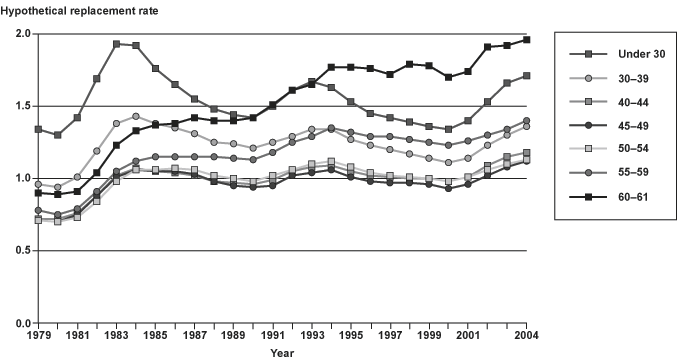
Ninetieth percentile hypothetical replacement rates for disability-insured workers based on last 3 years' average earnings (indexed to CPI), by age group, 1979–2004 (see Chart 10)
Ninetieth percentile hypothetical replacement rates for disability-insured workers based on last 3 years' average earnings (indexed to CPI), by age group, 1979–2004 (see Chart 10)
Show as table
| Year | Under 30 | 30–39 | 40–44 | 45–49 | 50–54 | 55–59 | 60–61 |
|---|---|---|---|---|---|---|---|
| 1979 | 1.34 | 0.96 | 0.72 | 0.71 | 0.71 | 0.78 | 0.90 |
| 1980 | 1.30 | 0.94 | 0.72 | 0.70 | 0.70 | 0.75 | 0.89 |
| 1981 | 1.42 | 1.01 | 0.76 | 0.75 | 0.73 | 0.79 | 0.91 |
| 1982 | 1.69 | 1.19 | 0.88 | 0.88 | 0.84 | 0.91 | 1.04 |
| 1983 | 1.93 | 1.38 | 1.02 | 1.01 | 0.98 | 1.05 | 1.23 |
| 1984 | 1.92 | 1.43 | 1.07 | 1.06 | 1.06 | 1.12 | 1.33 |
| 1985 | 1.76 | 1.38 | 1.05 | 1.05 | 1.06 | 1.15 | 1.37 |
| 1986 | 1.65 | 1.35 | 1.04 | 1.05 | 1.07 | 1.15 | 1.38 |
| 1987 | 1.55 | 1.31 | 1.02 | 1.03 | 1.06 | 1.15 | 1.42 |
| 1988 | 1.48 | 1.25 | 0.98 | 0.98 | 1.02 | 1.15 | 1.40 |
| 1989 | 1.44 | 1.24 | 0.97 | 0.95 | 1.00 | 1.14 | 1.40 |
| 1990 | 1.42 | 1.21 | 0.96 | 0.94 | 0.98 | 1.13 | 1.42 |
| 1991 | 1.50 | 1.25 | 0.99 | 0.95 | 1.02 | 1.18 | 1.51 |
| 1992 | 1.61 | 1.29 | 1.05 | 1.02 | 1.06 | 1.25 | 1.61 |
| 1993 | 1.67 | 1.34 | 1.08 | 1.04 | 1.10 | 1.29 | 1.65 |
| 1994 | 1.63 | 1.34 | 1.09 | 1.06 | 1.12 | 1.35 | 1.77 |
| 1995 | 1.53 | 1.27 | 1.05 | 1.01 | 1.08 | 1.32 | 1.77 |
| 1996 | 1.45 | 1.23 | 1.02 | 0.98 | 1.04 | 1.29 | 1.76 |
| 1997 | 1.42 | 1.20 | 1.01 | 0.97 | 1.02 | 1.29 | 1.72 |
| 1998 | 1.39 | 1.17 | 1.00 | 0.97 | 1.01 | 1.27 | 1.79 |
| 1999 | 1.36 | 1.14 | 1.00 | 0.96 | 1.00 | 1.25 | 1.78 |
| 2000 | 1.34 | 1.11 | 0.98 | 0.93 | 0.98 | 1.23 | 1.70 |
| 2001 | 1.40 | 1.14 | 1.01 | 0.96 | 1.01 | 1.26 | 1.74 |
| 2002 | 1.53 | 1.23 | 1.09 | 1.02 | 1.06 | 1.30 | 1.91 |
| 2003 | 1.66 | 1.30 | 1.15 | 1.08 | 1.10 | 1.34 | 1.92 |
| 2004 | 1.71 | 1.36 | 1.18 | 1.12 | 1.13 | 1.40 | 1.96 |
SOURCE: Author's calculations using Continuous Work History Sample data.
NOTE: CPI = Consumer Price Index.
Chart A-28.
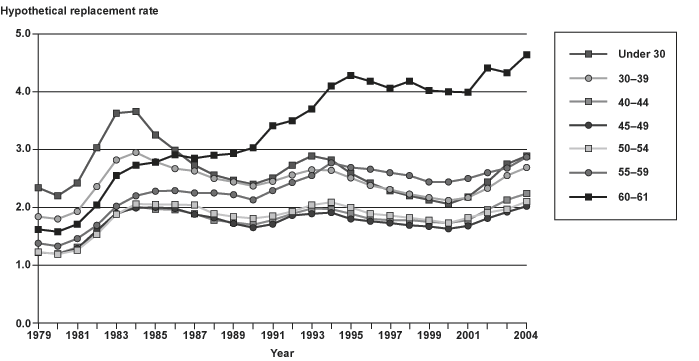
Ninety-fifth percentile hypothetical replacement rates for disability-insured workers based on last 3 years' average earnings (indexed to CPI), by age group, 1979–2004 (see Chart 10)
Ninety-fifth percentile hypothetical replacement rates for disability-insured workers based on last 3 years' average earnings (indexed to CPI), by age group, 1979–2004 (see Chart 10)
Show as table
| Year | Under 30 | 30–39 | 40–44 | 45–49 | 50–54 | 55–59 | 60–61 |
|---|---|---|---|---|---|---|---|
| 1979 | 2.34 | 1.84 | 1.22 | 1.23 | 1.23 | 1.38 | 1.62 |
| 1980 | 2.20 | 1.80 | 1.20 | 1.19 | 1.19 | 1.33 | 1.58 |
| 1981 | 2.42 | 1.93 | 1.31 | 1.29 | 1.26 | 1.46 | 1.71 |
| 1982 | 3.03 | 2.36 | 1.55 | 1.60 | 1.53 | 1.69 | 2.04 |
| 1983 | 3.63 | 2.82 | 1.88 | 1.90 | 1.88 | 2.02 | 2.55 |
| 1984 | 3.66 | 2.95 | 2.01 | 1.99 | 2.06 | 2.20 | 2.73 |
| 1985 | 3.25 | 2.79 | 1.97 | 2.00 | 2.05 | 2.28 | 2.78 |
| 1986 | 2.99 | 2.67 | 1.96 | 1.98 | 2.05 | 2.29 | 2.91 |
| 1987 | 2.73 | 2.63 | 1.89 | 1.88 | 2.04 | 2.25 | 2.85 |
| 1988 | 2.56 | 2.50 | 1.78 | 1.82 | 1.89 | 2.25 | 2.90 |
| 1989 | 2.47 | 2.44 | 1.74 | 1.72 | 1.84 | 2.22 | 2.93 |
| 1990 | 2.40 | 2.37 | 1.70 | 1.65 | 1.81 | 2.13 | 3.03 |
| 1991 | 2.51 | 2.45 | 1.78 | 1.71 | 1.85 | 2.29 | 3.41 |
| 1992 | 2.73 | 2.56 | 1.89 | 1.86 | 1.93 | 2.43 | 3.50 |
| 1993 | 2.89 | 2.65 | 1.98 | 1.89 | 2.04 | 2.55 | 3.70 |
| 1994 | 2.82 | 2.64 | 1.97 | 1.91 | 2.09 | 2.77 | 4.10 |
| 1995 | 2.59 | 2.51 | 1.89 | 1.80 | 2.00 | 2.69 | 4.28 |
| 1996 | 2.42 | 2.38 | 1.80 | 1.76 | 1.89 | 2.66 | 4.18 |
| 1997 | 2.29 | 2.31 | 1.78 | 1.73 | 1.86 | 2.60 | 4.06 |
| 1998 | 2.20 | 2.23 | 1.78 | 1.69 | 1.82 | 2.55 | 4.18 |
| 1999 | 2.13 | 2.17 | 1.75 | 1.67 | 1.78 | 2.44 | 4.02 |
| 2000 | 2.06 | 2.12 | 1.73 | 1.63 | 1.73 | 2.44 | 4.00 |
| 2001 | 2.18 | 2.17 | 1.78 | 1.68 | 1.82 | 2.50 | 3.99 |
| 2002 | 2.44 | 2.33 | 1.96 | 1.81 | 1.91 | 2.60 | 4.41 |
| 2003 | 2.75 | 2.55 | 2.13 | 1.92 | 1.97 | 2.68 | 4.33 |
| 2004 | 2.89 | 2.69 | 2.24 | 2.02 | 2.10 | 2.87 | 4.64 |
SOURCE: Author's calculations using Continuous Work History Sample data.
NOTE: CPI = Consumer Price Index.