Lifetime Distributional Effects of Social Security Retirement Benefits
Social Security Bulletin, Vol. 65, No. 1, 2003/2004 (released May 2004)
This article presents three measures of the distributional effects of Social Security benefits on actual and projected retirement income of workers born between 1931 and 1960. Microsimulations take into account marital history, the sharing of incomes and tax burdens within couples, and differences in life expectancy among subgroups of the population. More important than changes in tax rates or benefits are changes in the demographics and earnings patterns of the workforce, particularly the higher lifetime covered earnings of women. The growing share of women receiving worker benefits instead of spouse or survivor benefits, plus the increased proportion of retirees who are divorced, make Old-Age and Survivors Insurance (OASI) benefits more progressive, even in the face of declining net benefits.
Karen Smith is with the Urban Institute, Eric Toder is with the Internal Revenue Service, and Howard Iams is with the Division of Policy Evaluation, Office of Research, Evaluation, and Statistics, Office of Policy, Social Security Administration.
Acknowledgments: This paper was originally prepared for the Third Annual Joint Conference for the Retirement Research Consortium, "Making Hard Choices About Retirement," May 17–18, 2001, Washington, D.C. The opinions and conclusions are solely those of the authors and should not be construed as representing the opinions or policy of the Social Security Administration, the Internal Revenue Service, or any agency of the federal government or of the Boston College Center for Retirement Research, nor do they necessarily reflect the views of the Urban Institute, its board, or its sponsors. The research herein was performed pursuant to a grant from the Social Security Administration to the Boston College Center for Retirement Research.
The authors would like to acknowledge the outstanding research assistance of Jillian Berk.
Contents of this publication are not copyrighted; any items may be reprinted, but citation of the Social Security Bulletin as the source is requested. The findings and conclusions presented in the Bulletin are those of the authors and do not necessarily represent the views of the Social Security Administration.
Summary
This article presents three measures of the distribution of actual and projected net benefits (benefits minus payroll taxes) from Social Security's Old-Age and Survivors Insurance (OASI) for people born between 1931 and 1960. The results are based on simulations with the Social Security Administration's Model of Income in the Near Term (MINT), which projects retirement income through 2020. The base sample for MINT is the U.S. Census Bureau's Survey of Income and Program Participation panels for 1990 to 1993, matched with Social Security administrative records.
The study population is grouped into 5-year birth cohorts and then ranked by economic status in three ways. First, the population is divided into five groups on the basis of individual lifetime covered earnings, and their lifetime present values of OASI benefits received and payroll taxes paid are calculated. By this measure, OASI provides much higher benefits to the lowest quintile of earners than to other groups, but it becomes less redistributive toward lower earners in more recent birth cohorts.
Second, people are ranked by shared lifetime covered earnings, and the values of shared benefits received and payroll taxes paid are computed. Individuals are assumed to split covered earnings, benefits, and payroll taxes with their spouses in the years they are married. By the shared covered earnings measure, OASI is still much more favorable to persons in the lower income quintiles, although to a lesser degree than when people are ranked by individual covered earnings. OASI becomes more progressive among recent cohorts, even as net lifetime benefits decline for the entire population.
Finally, individuals are ranked on the basis of their shared permanent income from age 62, when they become eligible for early retirement benefits, until death. Their annual Social Security benefits are compared with the benefits they would have received if they had saved their payroll taxes in individual accounts and used the proceeds to buy either of two annuities that provide level payments from age 62 until death: a unisex annuity that is based on the average life expectancy of the birth cohort or an age-adjusted annuity that is based on the worker's own life expectancy. On the permanent income measure, OASI is generally more favorable to people in higher income quintiles. Moreover, it is particularly unfavorable to those in the lowest quintile. Because people in the lowest quintile have a shorter life expectancy, they receive OASI benefits for a shorter period. This group would receive greater benefits in retirement if they invested their payroll taxes in the age-adjusted annuity. OASI is more favorable to them than the unisex annuity, however. OASI is becoming more progressive in that the net benefits it provides drop more rapidly among higher income quintiles than lower ones.
This article also examines how OASI affects individuals by educational attainment, race, and sex. On both the lifetime covered earnings and the permanent income measures, OASI is more favorable to workers with less education and more favorable to women. The results by race and ethnicity are mixed. When people are ranked by the present value of their shared lifetime covered earnings, OASI appears more favorable to non-Hispanic blacks and Hispanics than to non-Hispanic whites. When people are ranked by shared permanent income in retirement, however, OASI produces negative returns for both non-Hispanic blacks and non-Hispanic whites in the most recent birth cohorts, with non-Hispanic blacks faring relatively worse.
The changes across cohorts occur partly because of changes in tax rates and benefits, but more importantly because of changing demographics and earnings patterns of the workforce. Of particular importance is the increasing share of beneficiaries who receive worker benefits instead of auxiliary benefits as wives or widows. OASI benefits are based on the lifetime covered earnings of current or former married couples, as well as on earned retirement benefits of individuals. The reduced importance of auxiliary benefits (due to the higher lifetime covered earnings of women) and the increased proportion of divorced retirees make OASI more progressive—even as net benefits decline—for current and future cohorts than for cohorts who retired in the 1990s.
Analysis of these findings suggests that simulations of policy changes in Social Security must take into account the decreasing importance of auxiliary benefits across birth cohorts and the complex changes in individuals' marital histories.
Introduction
Many people believe that the combination of payroll taxes and benefits in the Old-Age and Survivors Insurance (OASI) portion of Social Security redistributes income from couples and individuals with higher earnings to those with lower ones. The combination of a flat-rate payroll tax and a benefit formula that replaces a higher share of covered earnings for workers with low lifetime covered earnings appears to provide such a redistribution.
That view has been challenged by recent research findings based on longitudinal data sets. Gustman and Steinmeier (2000) note, for example, that the progressive benefit formula in OASI applies to covered earnings of individuals, not couples. In fact, much of the apparent redistribution takes place within couples, with high-earning workers contributing to the benefits of their low-earning spouses. Most of the remaining redistribution is eliminated if one counts the potential covered earnings of nonworking spouses (who receive substantial benefits from OASI) in a measure of total lifetime earning capacity. Coronado, Fullerton, and Glass (2000) make these same adjustments and then incorporate life expectancies. When they adjust for the longer life spans of persons with higher incomes, they find that Social Security is, on balance, regressive.1
This article provides new evidence on how OASI redistributes income among groups, based on simulations with the Model of Income in the Near Term (MINT), a microsimulation model developed at the Social Security Administration (SSA). The simulations show alternative measures of actual and projected net benefits (benefits minus payroll taxes) from OASI for a sample of individuals born between 1931 and 1960. The simulations take into account marital history, the sharing of incomes and tax burdens within couples, and differences in life expectancy among subgroups of the population.
Analyzing the Effects of OASI on Income Distribution
Examining how OASI payroll taxes and benefits redistribute income is meaningful only in comparison with some alternative fiscal policy. One common alternative (implicit or explicit in other studies) is to invest payroll taxes in an individual account that earns a market rate of return and provides retirement benefits only to the worker who contributes to it and his or her spouse. Two separate variations of that alternative are used here. In the first, it is assumed that each worker uses the proceeds of the investment to purchase an age-adjusted (actuarially fair) annuity that is based on the worker's own life expectancy and that provides level payments from age 62 until the worker's death. In the second, it is assumed that the worker is required to use the proceeds to buy a unisex annuity whose payments are based on the average life expectancy of the worker's birth cohort.2
How OASI Redistributes Income
The extent to which Social Security redistributes income depends on the balance between lifetime payroll taxes paid and benefits received by different subgroups. To understand how Social Security affects income distribution, one must examine OASI program rules (Social Security Administration 2001). OASI provides benefits for retired workers, spouses of retired workers, and surviving spouses (widows or widowers) of workers. Retired-worker benefits are computed by indexing annual covered earnings over a person's working life of 35 years and then calculating average indexed monthly earnings (AIME) and the primary insurance amount (PIA)—the benefit payable at full retirement age, currently 65 plus 2 months. Persons with 40 or more quarters of coverage during their work lives are fully insured and receive retired-worker benefits. Because the PIA formula pays benefits at a higher rate to those with lower lifetime earnings, it redistributes income from high-wage to low-wage workers. Some of this redistribution occurs within couples, however, enabling high-wage workers to benefit from the high replacement rate their low-wage spouses receive.
Focusing on individual earned benefits alone is an oversimplification, however, because aged persons without 40 quarters of coverage can still receive benefits through marriage. OASI provides auxiliary benefits to aged spouses and to surviving spouses of insured workers who are old enough to be eligible for benefits. An aged person can be eligible for half of a living spouse's benefit or for all of a deceased spouse's benefit, reduced for early retirement. Because entitlement to these auxiliary benefits occurs without additional payroll taxes from insured workers, their impact on net redistribution across income groups is unclear.3
Why OASI Benefits Will Become More Progressive Over Time
The net redistribution of OASI benefits will become more favorable to low-income groups over time because of the shifting demographic and earnings patterns in the last half of the 20th century. The benefit structure is a function of a person's lifetime covered earnings, his or her marital history, and his or her current and former spouse's lifetime covered earnings. Major changes in the lifetime covered earnings of recent cohorts of women, combined with dramatic shifts in marital history, have increased the likelihood that women will receive earned OASI benefits (Butrica, Iams, and Sandell 1999; Butrica and Iams 1999, 2000a, 2000b; Iams and Sandell 1997). For example, while a majority of wives in the Depression cohort will receive auxiliary benefits as wives, the majority of wives in the late baby-boom cohort will receive only their own earned benefits (Butrica, Iams, and Sandell 1999).
Although the two studies questioning net redistribution primarily cover intact marriages (Gustman and Steinmeier 2000; Coronado, Fullerton, and Glass 2000), OASI also provides auxiliary benefits to divorced persons who were married for 10 years to a worker who is eligible for benefits on the basis of age. Benefits for divorced spouses and surviving divorced spouses are based on the earnings history of the ex-spouse or deceased ex-spouse with the highest PIA. A woman is entitled to a divorced spouse benefit equaling essentially one-half of her ex-husband's PIA. Once her ex-husband dies, her benefit is essentially equal to his full PIA, unless it was reduced for early retirement. A divorced woman receives no auxiliary benefits if her marriage lasted less than 10 years. With divorce rates increasing, a larger proportion of recent birth cohorts will be divorced in retirement, and many aged divorced women will be economically vulnerable because some were married less than 10 years and many receive higher earned benefits than spouse benefits (Butrica and Iams 2000a). These divorced women will be reliant only on their own earnings histories and will benefit from the relatively high replacement rate that OASI provides to workers with low lifetime covered earnings.
Thus, recent changes in lifetime covered earnings of women and in marital history should make OASI more progressive. Because more women will have covered earnings, much less of the high replacement rates for low earners will benefit couples. Higher divorce rates will result in a much larger share of spouse and survivor benefits going to divorced women with low lifetime earnings.
Using MINT to Analyze How OASI Affects Income Distribution
The SSA's Office of Research, Evaluation, and Statistics developed the Model of Income in the Near Term with substantial assistance from the Brookings Institution, the RAND Corporation, and the Urban Institute (see Butrica, Iams, Moore, and Waid 2001; Panis and Lillard 1999; Toder and others 1999). The MINT data system projects the economic resources of current and future aged beneficiaries from retirement through death. It makes independent projections of each person's marital changes, mortality, and major sources of retirement income—namely, Social Security benefits, pensions, assets, age of first benefit receipt, and covered earnings of working beneficiaries. The base data file is the Census Bureau's Survey of Income and Program Participation (SIPP) 1990–1993 panels, matched to SSA administrative records for persons born in 1926 through 1965.
SIPP is a nationally representative survey that collects a wide range of data on a panel of respondents for about 3 years. It links husbands and wives and collects information for each adult in the survey. MINT draws upon SIPP data regarding marital changes and retrospective reports of marriage dates for up to three marriages. The model also draws upon SIPP information on pension coverage in the labor force and on wealth and assets. MINT statistically imputes SSA covered earnings records to the roughly 10 percent of respondents who are not matched to SSA records.
The MINT data system projects future marital histories and estimates characteristics of future and former spouses. Many people in MINT stayed with the same spouse in the 1990–1993 SIPP survey and are therefore matched with their current spouse until retirement age. For the other respondents, MINT based its estimates on the reported marital histories of the 1990–1991 SIPP panels, using gender-specific continuous time hazard models for marriage and divorce. The predictors were age, education, number of years unmarried, whether widowed, and calendar year after 1980. The last variable reflects the stabilization of divorce rates at a relatively high level in the early 1980s (Goldstein 1999). When tested for validity, the estimates were found to fit well with actual marital experiences of the 1992–1993 SIPP panels.
MINT also imputed the characteristics of former and future spouses and used those characteristics to establish a donor from MINT observations. The former or future spouse was statistically assigned from a MINT observation with similar characteristics—a nearest neighbor matching approach. The characteristics for assignment were based on the combination of similarity in spouse's birth date, Hispanic ethnicity, education, race, death date, disability date, disability status, permanent income, marriage start date, marriage end date, and marriage termination status (divorce, widow, death). Using a statistical function of distance, the procedure selected a donor and linked this donor as the imputed spouse. Thus, MINT uses observed and estimated marital histories with links to the characteristics of current, former, and future spouses to obtain the data it needs to estimate Social Security benefits.
The covered earnings projections for this analysis differ from the original MINT data system. That system, MINT1, based Social Security benefits on a person's covered earnings through age 65. Covered earnings comprised the person's actual covered earnings from 1951 through 1996 and projected earnings for 1997 and later years, with fixed-effects models of age-earnings patterns by sex and educational level. To increase the variability of projections, a revised version of the model, MINT2, was created. MINT2 uses the person's actual covered earnings from 1951 through 1998, but it projects covered earnings from 1999 through age 65 by means of the nearest neighbor matching procedure. In this case, the MINT donor is linked with a recipient in the same age interval who shares a number of the donor's characteristics, including sex, minority group status, education, disabled-worker entitlement, average covered earnings in the last 5-year period, presence of covered earnings in the fourth and fifth years of the 5-year period, and quintile (by age and sex) of average covered earnings before the match period. Because it does not use regression estimates of average age-earnings patterns, MINT2 replicates the variability of projected covered earnings patterns in historical data.
MINT projects death dates, which are a function of socioeconomic predictors as well as covered earnings. MINT2 projects deaths until age 65 through the nearest neighbor matching procedure. If the donor died in the period following the matched age interval, the recipient also died in his or her imputed age interval. The procedure adjusts total deaths by age and cohort through age 65 to fit projections of the SSA Office of the Chief Actuary. The expected death date after age 65 in MINT2 reflects a continuous time hazard model using the 1968–1994 Panel Study of Income Dynamics, or PSID (Panis and Lillard 1999), adjusted for the different mortality rates of those who had or had not received Disability Insurance benefits (Zayatz 1999). The model considered race, education, marital status, permanent income, calendar time, and age group (30 to 64 and 65 or older). The PSID death rates were adjusted to represent the U.S. National Vital Statistics rates. That model procedure is consistent with recent evidence of mortality compression and deceleration (Lynch and Brown 2001).
MINT2 also projects disability status, covered earnings of disabled workers, and disability benefits, but the analyses in this article exclude recipients of Social Security disability benefits. Several recent articles present descriptive characteristics of the MINT data system by birth cohort (Bosworth, Burtless, and Sahm 2001; Butrica and Iams 1999, 2000a, 2000b; Toder and others 1999, particularly chapters 7 and 8).
Other recent studies of the effects of Social Security on income distribution have also used detailed longitudinal data files, including the Health and Retirement Study, PSID, and a data file that matches the 1990–1991 SIPP with Social Security administrative records. MINT provides a richer and more complete data file for estimating the effects of OASI:
- It measures and projects years of marriage to determine whether the 10-year requirement is met for receiving benefits as a divorced (or widowed) ex-spouse;
- It estimates lifetime covered earnings of former and future spouses;
- It projects the level of retirement benefits earned from observed Social Security records of covered earnings through 1998 and from projected covered earnings until expected retirement;
- It projects mortality rates of retirees on the basis of their demographic characteristics; and
- It allows for the comparison of the life histories (covered earnings patterns, marriages, divorces, date of death) of different birth cohorts.
The changes described below across cohorts occur partly because of changes in tax rates and benefits but more importantly because of changing demographics and earnings patterns of the workforce. Of particular importance is the growing share of beneficiaries receiving worker benefits instead of auxiliary benefits as spouses or survivors. That increase, brought about by the higher lifetime covered earnings of women (Fullerton 1999; Hayghe 1990, 1993, 1997; Wetzel 1990), plus the increased proportion of retirees who are divorced (Clarke 1995) make OASI more progressive—even in the face of declining net benefits (Social Security Administration 2001)—for recent and future cohorts than for those who retired in the 1990s.
While these projections seem to be reasonable, it must be emphasized that they are only projections. MINT is still under development, with new and revised modules for retirement behavior, wealth accumulation and spend-down (among retirees), pension wealth and benefits, and Supplemental Security Income benefits and living arrangements. In addition, more testing will be done to validate the model's projections. Planned sensitivity tests include the impact on earnings projections of correlated spousal earnings, self-employment, immigration, and earnings not covered by Social Security payroll taxes. Thus, while the results in this article are informative about trends in the effects of OASI on income distribution, further model development may alter some of the conclusions.
Overall Approach
Measuring how OASI affects income distribution requires a number of methodological choices. The key choices are what measure or measures to use to classify people's economic status, how to measure payroll taxes paid, how to measure benefits received, and how to display the effects of OASI on income distribution.
Classifying Economic Status
The basic unit of observation in this study is the individual. Marriage is accounted for by assuming that married individuals evenly divide their total income and tax burden.
Three broad measures of economic status are used. People are ranked by:
- The present value of their own lifetime covered earnings.4
- The present value of their shared lifetime covered earnings. Shared earnings are computed by assigning each married person one-half of the couple's total covered earnings in the years when they are married and his or her own covered earnings in the years when single.5
- Shared permanent income at age 62 and later. Permanent income includes covered earnings, Social Security retirement benefits, income from defined benefit pension plans after age 62, and the annual payments from an actuarially fair joint and survivor annuity from wealth (excluding defined benefit pension and Social Security wealth) at age 62. Shared permanent income is an average annual amount that remains the same, in real terms, from age 62 until the individual's projected date of death.6 Permanent income is designed to measure available resources during retirement. Because this article focuses on the retirement period, it omits Social Security benefits before age 62.
People are also classified by sex, marital status, race, and educational level.
Ranking people by shared permanent income instead of the present value of lifetime covered earnings provides an alternative way of measuring economic status. With a lifetime covered earnings measure, two people who work until the same age and have the same covered earnings history are treated as having the same economic status. This makes sense as a measure of total resources available to a person over his or her lifetime. But a person with a longer life expectancy cannot support as high an annual standard of living as a person with a shorter life expectancy. One of the goals of Social Security is to maintain living standards in retirement for those who would otherwise spend down their savings. Thus it makes sense to consider an alternative measure, such as permanent income, that classifies people by their potential annual standard of living when they become eligible for Social Security early retirement benefits.
Measuring Payroll Taxes Paid
When people are classified by the present value of their own lifetime covered earnings, payroll taxes are measured as the present value of their own OASI payroll taxes.7 The present value of shared payroll taxes is used when people are classified by shared lifetime covered earnings. Shared payroll taxes are computed on the assumption that each married person pays half the total payroll taxes paid by the couple in the years they are married and that each pays his or her own payroll taxes in the years when they are single. The present value of payroll taxes measures how much the benefits are worth in terms of lifetime covered earnings.
When classifying people on the basis of permanent retirement income, the tax burden is the amount of permanent retirement income forgone because payroll taxes were contributed to the OASI trust fund instead of being saved by the individual and accrued at the market rate of interest.8 Forgone permanent income can be calculated in two ways. In one calculation, it is the annual income that the wealth would have produced until the individual died.9 In the other, it is the annual income that the wealth would have produced if the individual had been required to purchase a unisex joint and survivor annuity based on the average life expectancy of the individual's birth cohort. Using these two measures of forgone retirement benefits, one can calculate the portion of the redistribution from OASI that results from the structure of the benefit formula (including worker and auxiliary benefits) and the portion that results because the annual benefit does not vary with life expectancy.
Measuring Net Benefits Received
When people are classified on the basis of the present value of their own covered earnings, the net benefit is simply the present value of each person's OASI benefits. Similarly, when people are classified by shared covered earnings, the net benefit is the present value of shared OASI benefits. Shared OASI benefits are calculated on the assumption that each married person receives half of the total OASI benefit in the years they are married and his or her own OASI benefit in years when they are single.
When classifying people on the basis of shared permanent income, one must calculate a level real OASI benefit that has the same value in the present as in the future. For individuals who are unmarried at age 62 and who remain single until death, the real OASI benefit is the same every year after initial benefit receipt. For individuals who are married, however, annual benefits will typically change after the death of a spouse. (For people who begin to receive benefits after age 62, the annual amount is discounted to reflect the delay in starting benefits.)
Couples of different ages pose a special problem. Here, one spouse (typically the husband) receives benefits before the other. Because this analysis is interested in measuring the shared permanent income and benefits of people from age 62 onward, it does not count the wife's share of Social Security benefits that her husband receives before she reaches age 62 as part of her income or benefits (nor does it count widows' benefits received at ages 60 and 61). Only the income a wife receives beginning at age 62 is counted.10 Thus, her permanent income in retirement can differ substantially from the present value of her benefits, which counts all the Social Security benefits (individual and shared) that she receives over her lifetime. In particular, the permanent income measure of benefits can be very low relative to the present value measure for women who have much older spouses and a short life span after age 62.
Displaying Results
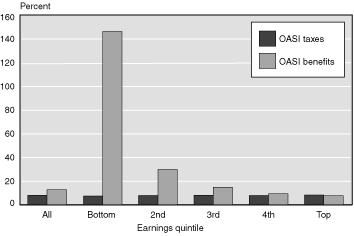
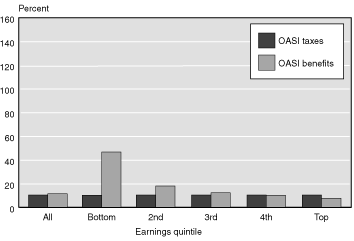
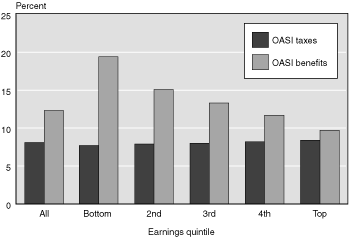
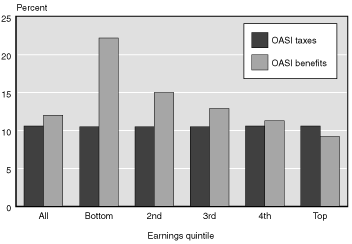
To report the effects of OASI on retirement income, people in each birth cohort from 1931–1935 through 1956–1960 were divided into five groups on the basis of the present value of their own or their shared lifetime covered earnings. Then payroll taxes, worker benefits, spousal benefits, survivor benefits, net benefits (benefits minus payroll taxes), and the percentage of benefits attributable to a worker's own covered earnings were calculated. To facilitate comparisons, the present value of payroll taxes, benefits, and net benefits are displayed as percentages of individual lifetime covered earnings (Charts 1 and 2) and shared lifetime covered earnings (Charts 3 and 4). All charts are based on data presented in corresponding tables; see also Tables 1 through 4.
To determine the effects of OASI on permanent retirement income, individuals in each birth cohort are divided into five groups on the basis of their permanent retirement income. The value of annual income attributable to OASI benefits (further subdivided into worker benefits, spousal benefits, and survivor benefits) was calculated and compared with the two measures of forgone benefits—that is, the age-adjusted and unisex retirement annuities described earlier. The results are shown in Charts 5 and 6 (see also Tables 5 and 6).
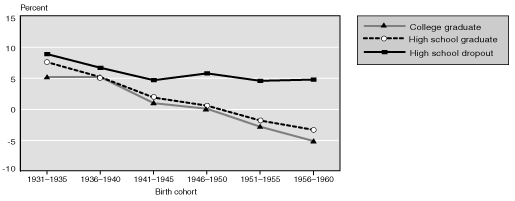
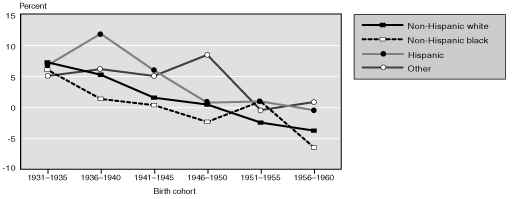
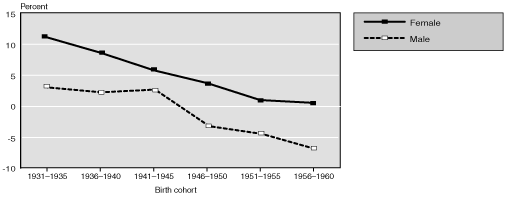
The distribution of OASI benefits by education, race and ethnicity, and sex were also determined, and their effects on the measures of shared lifetime earnings and on shared permanent income were calculated (Charts 7–10, respectively) (see also Tables 7 through 10). The results are discussed below.
Results of Simulations
When individuals are ranked by the present value of their lifetime covered earnings, OASI is, as expected, very redistributive (Chart 1, Table 1). For people born between 1931 and 1935, OASI provides net benefits to those in the bottom four quintiles. Workers in the lowest quintile receive the greatest net benefit—almost 1.5 times their lifetime income—whereas their payroll taxes were less than 8 percent of their lifetime income. Only 7 percent of the benefits in the bottom quintile come from workers' own covered earnings; the remainder are either spousal benefits or survivor benefits. In contrast, almost 100 percent of benefits in the top quintile are attributable to workers' earnings.
Present value of individual OASI taxes and benefits as a percentage of individual lifetime covered earnings
| Earnings quintile | Lifetime covered earnings (dollars) |
Percentage of covered earnings | Net benefits from OASI (percent) |
Percentage from worker benefits |
||||
|---|---|---|---|---|---|---|---|---|
| OASI taxes | Present value of Social Security benefits | |||||||
| Total | Worker | Spouse | Survivor | |||||
| 1931–1935 Birth cohort | ||||||||
| All | 1,112,444 | 8.2 | 12.8 | 9.7 | 0.8 | 2.4 | 4.6 | 75.5 |
| Bottom | 72,177 | 7.6 | 146.4 | 10.2 | 44.0 | 92.2 | 138.8 | 7.0 |
| 2nd | 391,234 | 8.1 | 30.0 | 16.7 | 2.7 | 10.7 | 21.9 | 55.6 |
| 3rd | 908,018 | 8.2 | 14.9 | 12.7 | 0.1 | 2.1 | 6.7 | 85.3 |
| 4th | 1,669,622 | 8.1 | 9.4 | 9.2 | 0 | 0.2 | 1.4 | 97.4 |
| Top | 2,521,170 | 8.4 | 7.9 | 7.8 | 0 | 0 | -0.5 | 99.9 |
| 1956–1960 Birth cohort | ||||||||
| All | 1,760,329 | 10.6 | 11.6 | 10.1 | 0.3 | 1.2 | 1.0 | 87.2 |
| Bottom | 271,239 | 10.4 | 46.8 | 19.0 | 8.9 | 19.0 | 36.4 | 40.5 |
| 2nd | 904,204 | 10.5 | 18.2 | 14.5 | 0.3 | 3.3 | 7.7 | 79.9 |
| 3rd | 1,546,713 | 10.5 | 12.5 | 11.5 | 0 | 1.0 | 2.0 | 92.2 |
| 4th | 2,350,899 | 10.6 | 10.3 | 10.0 | 0 | 0.2 | -0.3 | 97.8 |
| Top | 3,728,590 | 10.6 | 7.9 | 7.9 | 0 | 0 | -2.7 | 99.7 |
| SOURCE: Authors' calculations with MINT2. | ||||||||
| NOTES: Tax payments are based on individual earnings. Worker benefits are attributed to the worker. Spousal benefits are attributed to the spouse. Survivor benefits are attributed to the surviving spouse. | ||||||||
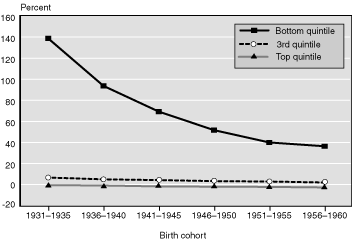
Redistribution from the highest to the lowest quintile remains substantial for the 1956–1960 birth cohort, but it declines over time (Chart 2, Table 2). The lowest quintile of workers is projected to receive far less in spousal and survivor benefits, per dollar of their own lifetime covered earnings, than the earlier cohorts. Nonetheless, they get substantial net benefits, both because they receive a very high replacement rate as workers and because the spousal and survivor benefits they receive are larger than those of earners in other quintiles. The disproportionate receipt of spousal and survivor benefits in the lowest quintile can be thought of as a transfer within the household if the recipient's spouse is in a higher earnings quintile.
Net OASI benefits as a percentage of individual lifetime covered earnings
| Earnings quintile | 1931–1935 | 1936–1940 | 1941–1945 | 1946–1950 | 1951–1955 | 1956–1960 |
|---|---|---|---|---|---|---|
| All | 4.6 | 3.7 | 2.8 | 2.0 | 1.7 | 1.0 |
| Bottom | 138.8 | 93.7 | 69.3 | 50.7 | 40.0 | 36.4 |
| 2nd | 21.9 | 17.8 | 13.6 | 10.4 | 9.1 | 7.7 |
| 3rd | 6.7 | 5.0 | 4.3 | 3.3 | 2.9 | 2.0 |
| 4th | 1.4 | 1.1 | 0.6 | 0.2 | 0.1 | -0.3 |
| Top | -0.5 | -0.9 | -1.7 | -2.0 | -2.2 | -2.7 |
| SOURCE: Authors' calculations with MINT2. | ||||||
| NOTES: Tax payments are based on individual earnings. Worker benefits are attributed to the worker. Spousal benefits are attributed to the spouse. Survivor benefits are attributed to the surviving spouse. | ||||||
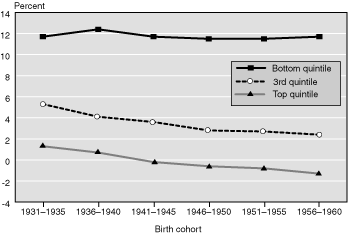
As expected, the redistribution from high to low earners is much less dramatic when workers are classified by the present value of shared lifetime earnings (Chart 3, Table 3).11 Auxiliary benefits remain a large proportion of benefits for workers with low shared earnings, reflecting the fact that many of those workers are women who receive spousal and survivor benefits but who have lower covered earnings than their spouses in the years they were not married. For individuals born between 1931 and 1935, all worker groups receive positive net benefits from OASI, but the net benefit as a percentage of lifetime covered earnings is highest in the bottom quintile (almost 12 percent) and lowest in the top quintile (just over 1 percent). For individuals born between 1956 and 1960, net benefits in the bottom quintile are also 12 percent, but net benefits in the other quintiles are less than they are for individuals born between 1931 and 1935, and net benefits in the top quintile are negative. Net benefits decline for successive cohorts after 1931–1935 in every quintile except the bottom one (Chart 4, Table 4). The result is that OASI is becoming less generous, but also more progressive, over time.
Present value of shared OASI taxes and benefits as a percentage of shared lifetime covered earnings
| Earnings quintile |
Lifetime covered earnings (dollars) |
Percentage of covered earnings | Net benefits from OASI (percent) |
Percentage from worker benefits |
||||
|---|---|---|---|---|---|---|---|---|
| OASI taxes | Present value of Social Security benefits |
|||||||
| Total | Worker | Spouse | Survivor | |||||
| 1931–1935 Birth cohort | ||||||||
| All | 1,135,356 | 8.1 | 12.3 | 9.3 | 0.7 | 2.3 | 4.2 | 75.5 |
| Bottom | 355,962 | 7.7 | 19.4 | 11.0 | 1.8 | 6.6 | 11.7 | 56.6 |
| 2nd | 842,028 | 7.9 | 15.1 | 9.7 | 1.0 | 4.4 | 7.3 | 64.3 |
| 3rd | 1,157,207 | 8.0 | 13.3 | 9.2 | 1.0 | 3.1 | 5.3 | 69.3 |
| 4th | 1,423,966 | 8.2 | 11.7 | 9.3 | 0.8 | 1.6 | 3.5 | 79.2 |
| Top | 1,896,726 | 8.4 | 9.7 | 8.9 | 0.2 | 0.6 | 1.3 | 92.0 |
| 1956–1960 Birth cohort | ||||||||
| All | 1,743,867 | 10.6 | 12.0 | 10.4 | 0.3 | 1.2 | 1.4 | 86.9 |
| Bottom | 518,225 | 10.5 | 22.2 | 15.9 | 1.5 | 4.8 | 11.7 | 71.6 |
| 2nd | 1,175,545 | 10.5 | 15.0 | 12.4 | 0.5 | 2.0 | 4.5 | 82.9 |
| 3rd | 1,665,838 | 10.5 | 12.9 | 11.0 | 0.4 | 1.5 | 2.4 | 85.1 |
| 4th | 2,199,465 | 10.6 | 11.3 | 9.9 | 0.3 | 1.1 | 0.7 | 88.0 |
| Top | 3,159,851 | 10.6 | 9.2 | 8.9 | 0.1 | 0.3 | -1.3 | 95.9 |
| SOURCE: Authors' calculations with MINT2. | ||||||||
| NOTES: Tax payments are based on shared earnings. Earnings of unmarried workers are attributed to the worker. Earnings of married workers are combined; each spouse gets 50 percent of earnings for purpose of measuring lifetime present value of earnings and attributing tax burdens. | ||||||||
| Benefits are shared by couples. Married individuals are assumed to receive half the combined benefit of the couple. Single individuals receive whatever benefit they get, whether based on their own earnings, spousal benefit (for divorced individuals), or survivor benefit (for widow(er)s). | ||||||||
Net OASI benefits as a percentage of shared lifetime covered earnings
| Earnings quintile | 1931–1935 | 1936–1940 | 1941–1945 | 1946–1950 | 1951–1955 | 1956–1960 |
|---|---|---|---|---|---|---|
| All | 4.2 | 3.5 | 2.7 | 2.1 | 1.8 | 1.4 |
| Bottom | 11.7 | 12.4 | 11.7 | 11.5 | 11.5 | 11.7 |
| 2nd | 7.3 | 6.4 | 5.5 | 5.0 | 4.9 | 4.5 |
| 3rd | 5.3 | 4.1 | 3.6 | 2.8 | 2.7 | 2.4 |
| 4th | 3.5 | 3.0 | 2.0 | 1.3 | 1.0 | 0.7 |
| Top | 1.3 | 0.7 | -0.2 | -0.6 | -0.8 | -1.3 |
| SOURCE: Authors' calculations with MINT2. | ||||||
| NOTES: Tax payments are based on shared earnings. Earnings of unmarried workers are attributed to the worker. Earnings of married workers are combined; each spouse gets 50 percent of earnings for purpose of measuring lifetime present value of earnings and attributing tax burdens.
Benefits are shared by couples. Married individuals are assumed to receive half the combined benefit of the couple. Single individuals receive whatever benefit they get, whether based on their own earnings, spousal benefit (for divorced individuals), or survivor benefit (for widow(er)s).
|
||||||
One reason OASI is becoming more progressive for workers ranked by shared lifetime earnings is that worker benefits have risen relative to auxiliary benefits. This rise reflects the overall increase in lifetime covered earnings of women. Higher lifetime covered earnings boost both the worker benefits women receive and the OASI payroll taxes women pay. They also reduce spousal and survivor benefits. The share of benefits accounted for by a worker's own covered earnings increased between the 1931–1935 and 1956–1960 birth cohorts in all quintiles of the income distribution. Overall, that share is projected to increase from 76 percent of benefits for workers born between 1931 and 1935 to 87 percent of benefits for workers born between 1956 and 1960.
The shorter life expectancy of low-earning workers should in itself reduce their relative net benefit from OASI. Yet the benefit formula is so favorable to low-earning workers that even using the shared covered earnings measure, they receive a better deal from OASI over their lifetime than high-earning workers. The lowest quintile includes many persons from economically vulnerable households; however, it also includes some workers who have low lifetime earnings covered by Social Security but high earnings from jobs not covered by Social Security. Such workers can have high pensions and wealth and longer life expectancies.
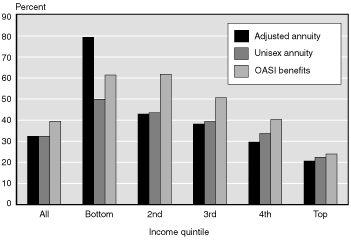
If one ranks individuals by shared permanent income, the picture is quite different (Charts 5 and 6). For individuals born between 1931 and 1935, net benefits from OASI decline from 19 percent of income in the second quintile to just over 3 percent of income in the top quintile (Table 5). But in the bottom quintile of this birth cohort, net benefits from OASI are negative 18 percent of income.
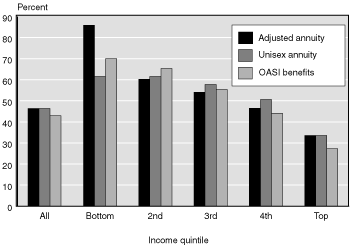
OASI benefits and forgone benefits as a percentage of shared permanent income at age 62
| Income quintile | Forgone benefits | Net benefits from OASI a | Net benefits (percent) | ||||||||
|---|---|---|---|---|---|---|---|---|---|---|---|
| Annual income (dollars) |
Unisex annuity b |
Adjusted annuity c |
Total | Worker | Spouse | Survivor | Unisex annuity d |
Unisex- adjusted annuity e |
OASI f | From worker benefits g |
|
| 1931–1935 Birth cohort | |||||||||||
| All | 20,815 | 32.5 | 32.5 | 39.6 | 29.7 | 2.2 | 7.7 | 7.2 | 0 | 7.2 | 75.0 |
| Bottom | 7,008 | 49.9 | 79.4 | 61.4 | 43.0 | 4.9 | 13.5 | 11.5 | -29.4 | -18.0 | 70.0 |
| 2nd | 13,234 | 43.5 | 42.9 | 61.8 | 41.4 | 3.5 | 16.9 | 18.2 | 0.6 | 18.8 | 67.0 |
| 3rd | 17,851 | 39.4 | 38.2 | 50.7 | 37.2 | 3.0 | 10.5 | 11.3 | 1.2 | 12.5 | 73.4 |
| 4th | 23,986 | 33.7 | 29.6 | 40.3 | 31.5 | 2.1 | 6.7 | 6.6 | 4.1 | 10.7 | 78.1 |
| Top | 41,994 | 22.4 | 20.6 | 24.0 | 19.7 | 1.2 | 3.2 | 1.5 | 1.9 | 3.4 | 82.0 |
| 1956–1960 Birth cohort | |||||||||||
| All | 28,197 | 46.4 | 46.4 | 42.9 | 37.2 | 1.2 | 4.6 | -3.5 | 0 | -3.5 | 86.6 |
| Bottom | 9,447 | 61.5 | 85.9 | 70.0 | 56.8 | 4.0 | 9.2 | 8.5 | -24.5 | -16.0 | 81.2 |
| 2nd | 16,561 | 61.5 | 60.2 | 65.4 | 54.0 | 2.2 | 9.3 | 4.0 | 1.3 | 5.3 | 82.5 |
| 3rd | 22,971 | 57.7 | 54.1 | 55.4 | 46.7 | 1.4 | 7.3 | -2.3 | 3.6 | 1.3 | 84.3 |
| 4th | 31,687 | 50.6 | 46.5 | 44.1 | 38.6 | 0.9 | 4.5 | -6.6 | 4.2 | -2.4 | 87.7 |
| Top | 60,321 | 33.5 | 33.6 | 27.2 | 25.1 | 0.5 | 1.6 | -6.3 | -0.1 | -6.4 | 92.2 |
| SOURCE: Authors' calculations with MINT2. | |||||||||||
| NOTE: All annuities for married couples are assumed to be joint and survivor annuities, with survivor receiving 50 percent of combined benefit of couple.
Tax payments are based on shared earnings. Earnings of unmarried workers are attributed to the worker. Earnings of married workers are combined; each spouse gets 50 percent of earnings for purpose of attributing tax burdens.
Benefits are shared by couples. Married individuals are assumed to receive half the combined benefit of the couple. Single individuals receive whatever benefit they get, whether based on their own earnings, spousal benefit (for divorced individuals), or survivor benefit (for widow(er)s).
|
|||||||||||
| a. Level annual benefit beginning at age 62 that is equal to the present value of per capita lifetime benefits received by the couple. | |||||||||||
| b. Level annuity that worker could purchase at age 62 with present value of lifetime tax payments, under the assumption that annuity rate depends on cohort's average life expectancy. | |||||||||||
| c. Level annuity that worker could purchase at age 62 with present value of lifetime tax payments, under the assumption that worker can accurately forecast life span. | |||||||||||
| d. Equals net benefit from OASI minus forgone benefits under a unisex annuity. | |||||||||||
| e. Equals net benefit from a unisex annuity minus forgone benefits under an annuity based on actual life span. | |||||||||||
| f. Equals net benefit from OASI minus forgone benefits under an annuity based on actual life span. | |||||||||||
| g. Percentage of total OASI benefit from the worker benefit. | |||||||||||
Net OASI benefits as a percentage of shared permanent income at age 62
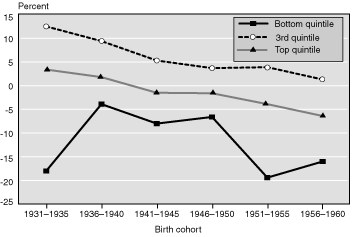
| Income quintile | 1931–1935 | 1936–1940 | 1941–1945 | 1946–1950 | 1951–1955 | 1956–1960 |
|---|---|---|---|---|---|---|
| All | 7.2 | 5.4 | 1.8 | 0.7 | -1.9 | -3.5 |
| Bottom | -18.0 | -3.9 | -8.0 | -6.6 | -19.4 | -16.0 |
| 2nd | 18.8 | 13.9 | 12.2 | 7.4 | 4.5 | 5.3 |
| 3rd | 12.5 | 9.4 | 5.3 | 3.7 | 3.9 | 1.3 |
| 4th | 10.7 | 7.0 | 2.7 | 1.2 | -0.7 | -2.4 |
| Top | 3.4 | 1.8 | -1.5 | -1.6 | -3.9 | -6.4 |
| SOURCE: Authors' calculations with MINT2. | ||||||
| NOTES: Tax payments are based on shared earnings. Earnings of unmarried workers are attributed to the worker. Earnings of married workers are combined; each spouse gets 50 percent of earnings for purpose of attributing tax burdens.
Benefits are shared by couples. Married individuals are assumed to receive half the combined benefit of the couple. Single individuals receive whatever benefit they get, whether based on their own earnings, spousal benefit (for divorced individuals), or survivor benefit (for widow(er)s).
|
||||||
The main reason OASI hurts retirees in the bottom income quintile is that their life expectancies are relatively short. The two measures of forgone benefits illustrate this (Chart 5, Table 5). If individuals in the lowest permanent income quintile had invested their payroll taxes, bought an age-adjusted annuity at age 62, and then spent down their wealth to zero by their projected age of death, those born between 1931 and 1935 could have received, on average, an annual benefit worth almost 80 percent of their permanent retirement income.12 In contrast, purchasing a unisex annuity with the same savings would have yielded them an annual benefit worth only 50 percent of their retirement income. Thus, buying an annuity that does not reflect the shorter life expectancy of persons in the lowest quintile reduces their annual benefits by about 30 percent of total retirement income. OASI gives them 61 percent of their retirement income, reflecting the high OASI replacement rate for low earners (presumed to be, for the most part, the same people as low-income retirees). These findings seem to approximate choices in the real world. The MINT data system predicts the age that Social Security benefits will begin, from age 62 through age 66, reflecting the fact that workers can choose when to start benefits. Of course, the expected Social Security benefits would be less if a person with a shorter life expectancy chose to start benefits after age 62.
The situation is similar for individuals born between 1956 and 1960 except that net benefits become negative for individuals in the top two quintiles of the income distribution as well as for those in the lowest quintile (Table 5). On average, net retirement income from OASI for the 1956–1960 birth cohort is less than the net income from the age-adjusted annuity. Note, however, that this measure of net retirement income does not include all the benefits of OASI: it excludes benefits that widowed and married individuals receive (either as survivor benefits or as a share of worker benefits received by their spouse) before they reach age 62.
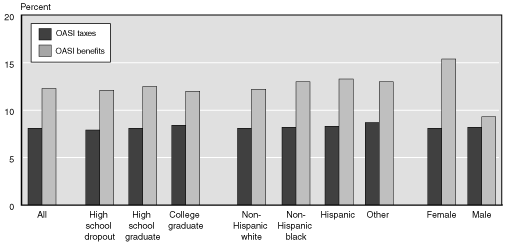
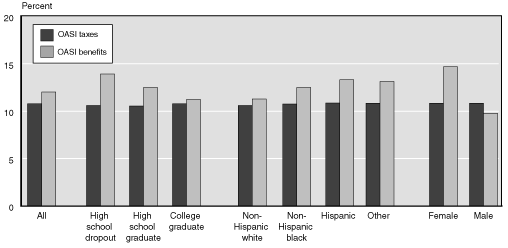
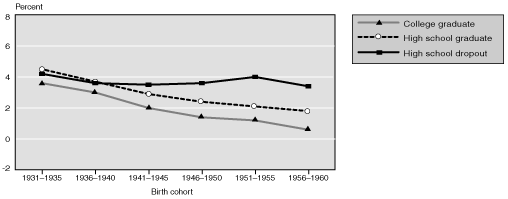
Net benefits from OASI also vary by education, race, and sex. On the shared lifetime earnings measure, OASI benefits are higher for less educated than for more educated workers, particularly in more recent birth cohorts; higher for Hispanics and non-Hispanic blacks than for non-Hispanic whites, and much higher for women than for men (Charts 7 and 8, Tables 7 and 8). The simulation shows that the percentage of OASI benefits stemming from a worker's own earnings rather than from auxiliary benefits also differs among groups. Workers' own benefits are relatively greater as educational level increases, and they are greater for men than for women. The proportion does not vary much among racial groups (Table 7). The higher benefits for women result largely from their longer life expectancy. Women share income with their spouses when both are alive, and they continue permanent income after their spouse has died, yielding a higher lifetime income. Unmarried men are more likely to receive worker benefits than unmarried women. Net benefits have declined for each successive birth cohort between 1931–1935 and 1956–1960 across all educational, racial, and gender groups (Chart 8). Although benefits remain positive for all educational and racial groups in the more recent birth cohorts, they become negative for men (Chart 8).
Present value of OASI benefits on shared earnings as a percentage of shared lifetime earnings, by education, race and ethnicity, and sex
| Education, race and ethnicity, and sex | Lifetime covered earnings (dollars) |
Percentage of covered earnings | Net benefits from OASI (percent) |
Percentage from worker benefits |
||||
|---|---|---|---|---|---|---|---|---|
| OASI taxes | Present value of Social Security benefits |
|||||||
| Total | Worker | Spouse | Survivor | |||||
| 1931–1935 Birth cohort | ||||||||
| All | 1,135,356 | 8.1 | 12.3 | 9.3 | 0.7 | 2.3 | 4.2 | 75.5 |
| Education | ||||||||
| High school dropout | 899,077 | 7.9 | 12.1 | 8.2 | 0.7 | 3.3 | 4.2 | 67.4 |
| High school graduate | 1,175,225 | 8.1 | 12.5 | 9.5 | 0.7 | 2.3 | 4.5 | 75.7 |
| College graduate | 1,331,903 | 8.4 | 12.0 | 9.9 | 0.7 | 1.5 | 3.6 | 82.1 |
| Race and ethnicity | ||||||||
| Non-Hispanic white | 1,190,254 | 8.1 | 12.2 | 9.2 | 0.7 | 2.3 | 4.1 | 75.6 |
| Non-Hispanic black | 905,170 | 8.2 | 13.0 | 9.5 | 0.5 | 2.9 | 4.8 | 73.6 |
| Hispanic | 873,613 | 8.3 | 13.3 | 10.0 | 0.7 | 2.6 | 5.0 | 75.1 |
| Other | 862,518 | 8.7 | 13.0 | 10.1 | 0.6 | 2.3 | 4.3 | 77.3 |
| Sex | ||||||||
| Female | 1,077,125 | 8.1 | 15.4 | 10.2 | 0.8 | 4.5 | 7.4 | 65.8 |
| Male | 1,199,418 | 8.2 | 9.3 | 8.5 | 0.7 | 0.1 | 1.1 | 91.3 |
| 1956–1960 Birth cohort | ||||||||
| All | 1,743,867 | 10.6 | 12.0 | 10.4 | 0.3 | 1.2 | 1.4 | 86.9 |
| Education | ||||||||
| High school dropout | 948,747 | 10.5 | 13.9 | 10.9 | 0.6 | 2.5 | 3.4 | 78.3 |
| High school graduate | 1,635,644 | 10.5 | 12.3 | 10.6 | 0.3 | 1.4 | 1.8 | 86.1 |
| College graduate | 2,311,622 | 10.6 | 11.2 | 10.1 | 0.3 | 0.8 | 0.6 | 90.2 |
| Race and ethnicity | ||||||||
| Non-Hispanic white | 1,870,876 | 10.5 | 11.8 | 10.3 | 0.3 | 1.2 | 1.2 | 87.1 |
| Non-Hispanic black | 1,359,381 | 10.6 | 12.5 | 11.0 | 0.3 | 1.2 | 1.9 | 88.5 |
| Hispanic | 1,260,106 | 10.6 | 13.2 | 11.2 | 0.4 | 1.6 | 2.6 | 84.8 |
| Other | 1,642,883 | 10.6 | 12.9 | 10.9 | 0.5 | 1.5 | 2.3 | 84.6 |
| Sex | ||||||||
| Female | 1,672,372 | 10.6 | 14.3 | 11.8 | 0.4 | 2.2 | 3.8 | 82.4 |
| Male | 1,820,107 | 10.6 | 9.7 | 9.1 | 0.3 | 0.3 | -0.8 | 93.5 |
| SOURCE: Authors' calculations with MINT2. | ||||||||
| NOTES: Tax payments are based on shared earnings. Earnings of unmarried workers are attributed to the worker. Earnings of married workers are combined; each spouse gets 50 percent of earnings for purpose of measuring lifetime present value of earnings and attributing tax burdens.
Benefits are shared by couples. Married individuals are assumed to receive half the combined benefit of the couple. Single individuals receive whatever benefit they get, whether based on their own earnings, spousal benefit (for divorced individuals), or survivor benefit (for widows and widowers).
|
||||||||
Net OASI benefits on shared earnings as a percentage of shared lifetime earnings, by education, race and ethnicity, and sex
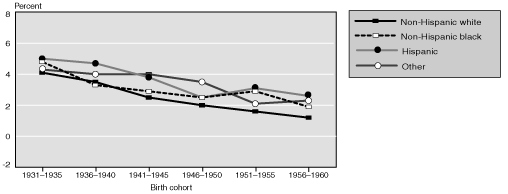
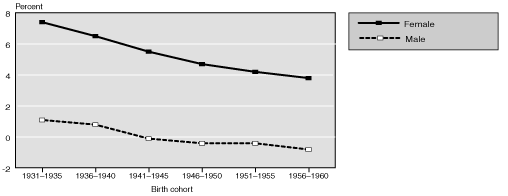
| Education, race and ethnicity, and sex | 1931–1935 | 1936–1940 | 1941–1945 | 1946–1950 | 1951–1955 | 1956–1960 |
|---|---|---|---|---|---|---|
| All | 4.2 | 3.5 | 2.7 | 2.1 | 1.8 | 1.4 |
| Education | ||||||
| High school dropout | 4.2 | 3.6 | 3.5 | 3.6 | 4.0 | 3.4 |
| High school graduate | 4.5 | 3.7 | 2.9 | 2.4 | 2.1 | 1.8 |
| College graduate | 3.6 | 3.0 | 2.0 | 1.4 | 1.2 | 0.6 |
| Race and ethnicity | ||||||
| Non-Hispanic white | 4.1 | 3.5 | 2.5 | 2.0 | 1.6 | 1.2 |
| Non-Hispanic black | 4.8 | 3.3 | 2.9 | 2.5 | 2.9 | 1.9 |
| Hispanic | 5.0 | 4.7 | 3.8 | 2.5 | 3.1 | 2.6 |
| Other | 4.3 | 4.0 | 4.0 | 3.5 | 2.1 | 2.3 |
| Sex | ||||||
| Female | 7.4 | 6.5 | 5.5 | 4.7 | 4.2 | 3.8 |
| Male | 1.1 | 0.8 | -0.1 | -0.4 | -0.4 | -0.8 |
| SOURCE: Authors' calculations with MINT2. | ||||||
| NOTES: Earnings of unmarried workers are attributed to the worker. Earnings of married workers are combined; each spouse gets 50 percent of earnings for purpose of measuring lifetime present value of earnings and attributing tax burdens.
Married individuals are assumed to receive half the combined benefit of the couple. Single individuals receive whatever benefit they get, whether based on their own earnings, spousal benefit (for divorced individuals), or survivor benefit (for widow(er)s).
|
||||||
On the permanent income measure, OASI still redistributes income from more to less educated individuals and from men to women, especially for the 1956 1960 birth cohort (Charts 9 and 10, Tables 9 and 10), but non-Hispanic blacks generally do less well under OASI than non-Hispanic whites. Net benefits are declining for all educational and racial groups and for both men and women. In more recent birth cohorts, net benefits are negative for individuals with a high school or college education, for both non-Hispanic whites and non-Hispanic blacks, and for men (Table 10).
OASI benefits and forgone benefits as a percentage of shared permanent income at age 62, by education, race and ethnicity, and sex
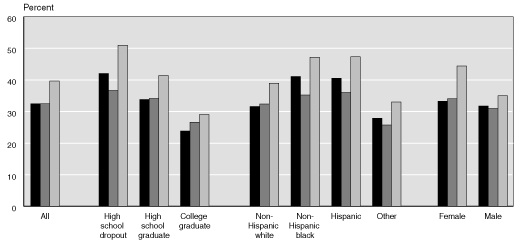
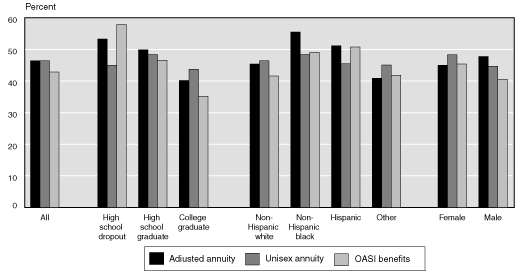
| Education, race and ethnicity, and sex | Forgone benefits | Net benefits from OASI a | Net benefits (percent) | ||||||||
|---|---|---|---|---|---|---|---|---|---|---|---|
| Annual income (dollars) |
Unisex annuity b |
Adjusted annuity c |
Total | Worker | Spouse | Survivor | Unisex annuity d |
Unisex- adjusted annuity e |
OASI f | From worker benefits g |
|
| 1931–1935 Birth cohort | |||||||||||
| All | 20,818 | 32.5 | 32.5 | 39.6 | 29.7 | 2.2 | 7.7 | 7.2 | 0 | 7.2 | 75.0 |
| Education | |||||||||||
| High school dropout | 14,252 | 36.7 | 42.1 | 51.0 | 34.2 | 2.8 | 14.0 | 14.3 | -5.4 | 8.9 | 67.1 |
| High school graduate | 20,446 | 34.1 | 33.8 | 41.4 | 31.4 | 2.4 | 7.6 | 7.3 | 0.3 | 7.6 | 75.9 |
| College graduate | 30,741 | 26.6 | 23.8 | 29.0 | 23.5 | 1.6 | 3.9 | 2.5 | 2.8 | 5.2 | 81.0 |
| Race and ethnicity | |||||||||||
| Non-Hispanic white | 21,833 | 32.4 | 31.6 | 38.9 | 29.2 | 2.3 | 7.4 | 6.6 | 0.8 | 7.3 | 75.0 |
| Non-Hispanic black | 15,400 | 35.3 | 41.1 | 47.2 | 34.8 | 1.9 | 10.6 | 12.0 | -5.9 | 6.1 | 73.6 |
| Hispanic | 14,792 | 36.0 | 40.5 | 47.4 | 35.3 | 2.7 | 9.4 | 11.3 | -4.5 | 6.8 | 74.6 |
| Other | 20,888 | 25.7 | 27.9 | 33.0 | 25.5 | 1.5 | 6.0 | 7.3 | -2.1 | 5.1 | 77.2 |
| Sex | |||||||||||
| Female | 19,547 | 34.1 | 33.3 | 44.4 | 30.2 | 2.5 | 11.8 | 10.3 | 0.8 | 11.2 | 68.0 |
| Male | 22,216 | 30.9 | 31.7 | 35.0 | 29.3 | 2.0 | 3.7 | 4.1 | -0.8 | 3.3 | 83.6 |
| 1956–1960 Birth cohort | |||||||||||
| All | 28,201 | 46.4 | 46.4 | 42.9 | 37.2 | 1.2 | 4.6 | -3.5 | 0 | -3.5 | 86.6 |
| Education | |||||||||||
| High school dropout | 15,897 | 45.0 | 53.1 | 57.9 | 45.5 | 2.3 | 10.2 | 12.9 | -8.1 | 4.8 | 78.6 |
| High school graduate | 25,292 | 48.4 | 49.9 | 46.6 | 40.1 | 1.2 | 5.3 | -1.8 | -1.5 | -3.3 | 86.1 |
| College graduate | 39,839 | 43.7 | 40.2 | 35.2 | 31.5 | 0.9 | 2.8 | -8.6 | 3.5 | -5.1 | 89.5 |
| Race and ethnicity | |||||||||||
| Non-Hispanic white | 30,231 | 46.4 | 45.4 | 41.6 | 36.1 | 1.1 | 4.4 | -4.8 | 1.0 | -3.7 | 86.7 |
| Non-Hispanic black | 21,124 | 48.4 | 55.5 | 49.1 | 43.1 | 1.0 | 5.0 | 0.8 | -7.1 | -6.4 | 87.8 |
| Hispanic | 20,978 | 45.5 | 51.2 | 50.8 | 43.3 | 1.5 | 6.0 | 5.3 | -5.7 | -0.4 | 85.2 |
| Other | 27,774 | 45.1 | 40.9 | 41.8 | 35.4 | 1.5 | 5.0 | -3.2 | 4.2 | 0.9 | 84.5 |
| Sex | |||||||||||
| Female | 26,764 | 48.3 | 45.0 | 45.4 | 38.1 | 1.2 | 6.0 | -2.9 | 3.3 | 0.4 | 84.0 |
| Male | 29,733 | 44.7 | 47.8 | 40.6 | 36.3 | 1.1 | 3.3 | -4.1 | -3.2 | -7.2 | 89.3 |
| SOURCE: Authors' calculations with MINT2. | |||||||||||
| NOTES: All annuities for married couples are assumed to be joint and survivor annuities, with survivor receiving 50 percent of combined benefit of couple.
Tax payments are based on shared earnings. Earnings of unmarried workers are attributed to the worker. Earnings of married workers are combined; each spouse gets 50 percent of earnings for purpose of attributing tax burdens.
Benefits are shared by couples. Married individuals are assumed to receive half the combined benefit of the couple. Single individuals receive whatever benefit they get, whether based on their own earnings, spousal benefit (for divorced individuals), or survivor benefit (for widow(er)s).
|
|||||||||||
| a. Level annual benefit beginning at age 62 that is equal to the present value of per capita lifetime benefits received by the couple. | |||||||||||
| b. Level annuity that worker could purchase at age 62 with present value of lifetime tax payments, under the assumption that annuity rate depends on cohort average life expectancy. | |||||||||||
| c. Level annuity that worker could purchase at age 62 with present value of lifetime tax payments, under the assumption that worker can accurately forecast life span. | |||||||||||
| d. Equals net benefit from OASI minus forgone benefits under a unisex annuity. | |||||||||||
| e. Equals net benefit from a unisex annuity minus forgone benefits under an annuity based on actual life span. | |||||||||||
| f. Equals net benefit from OASI minus forgone benefits under an annuity based on actual life span. | |||||||||||
| g. Percentage of total OASI benefit from the worker benefit. | |||||||||||
Net OASI benefits as a percentage of shared permanent income at age 62, by education, race and ethnicity, and sex
| Education, race and ethnicity, and sex | 1931–1935 | 1936–1940 | 1941–1945 | 1946–1950 | 1951–1955 | 1956–1960 |
|---|---|---|---|---|---|---|
| All | 7.2 | 5.4 | 1.8 | 0.7 | -1.9 | -3.5 |
| Education | ||||||
| High school dropout | 8.9 | 6.7 | 4.7 | 5.8 | 4.6 | 4.8 |
| High school graduate | 7.6 | 5.2 | 1.9 | 0.6 | -1.8 | -3.3 |
| College graduate | 5.2 | 5.2 | 1.0 | 0.1 | -2.8 | -5.1 |
| Race and ethnicity | ||||||
| Non-Hispanic white | 7.3 | 5.3 | 1.6 | 0.5 | -2.4 | -3.7 |
| Non-Hispanic black | 6.1 | 1.4 | 0.4 | -2.3 | 1.0 | -6.4 |
| Hispanic | 6.8 | 11.9 | 6.0 | 0.8 | 1.0 | -0.4 |
| Other | 5.1 | 6.2 | 5.1 | 8.5 | -0.4 | 0.9 |
| Sex | ||||||
| Female | 11.2 | 8.6 | 5.7 | 4.3 | 0.7 | 0.4 |
| Male | 3.3 | 2.3 | 2.6 | -2.7 | -4.4 | -7.2 |
| SOURCE: Authors' calculations with MINT2. | ||||||
| NOTES: Tax payments are based on shared earnings. Earnings of unmarried workers are attributed to the worker. Earnings of married workers are combined; each spouse gets 50 percent of earnings for purpose of measuring lifetime present value of earnings and attributing tax burdens.
Benefits are shared by couples. Married individuals are assumed to receive half the combined benefit of the couple. Single individuals receive whatever benefit they get, whether based on their own earnings, spousal benefit (for divorced individuals), or survivor benefit (for widows and widowers).
|
||||||
Notes
1. Other researchers have examined how differential mortality rates reduce the degree to which Social Security redistributes income to low-wage workers. See, for example, Aaron (1977) and Duggan, Gillingham, and Greenlees (1993).
2. The findings in this article do not indicate the net effects of replacing OASI in whole or in part with individual accounts because they do not account for the costs of transition to a new system. Instead, the results show how the OASI benefit formula affects subgroups within each cohort, compared with how they would fare if their retirement benefits were based on the accrued value of the payroll taxes they paid.
3. Technically, OASI can pay earned worker and auxiliary benefits to a person entitled to both types of benefits, but in practice the payment is limited to the larger of the two. Because women's lifetime earnings are lower on average than their husbands', many women receive higher benefits as spouses or surviving spouses than as retired workers. SSA calculates the earned benefit and pays a supplement equal to the difference between that benefit and the full spousal or survivor's benefit to which the person is entitled.
4. The MINT data system records all earnings covered by Social Security payroll taxes. MINT uses the actual record of SSA covered earnings from 1951 through 1998 and projected earnings until age 65 for succeeding years. This analysis uses lifetime earnings with wage indexing following the method for Social Security basic benefits.
5. This method of shared earnings applies the basic principle of proposals for "earnings sharing."
6. In calculating shared permanent income at age 62 and later, each married individual is assigned half of the couple's total income in the years they are married and their own income in the years they are single. Spousal and survivor's benefits received by divorced spouses are all attributed to the recipient. The calculation uses the present value at age 62.
7. Both employer and employee shares of payroll taxes are counted, on the assumption that the worker bears the economic burden of both. Payroll taxes fund OASI benefits to retired workers, aged spouses of workers, and survivors. Because this analysis focuses on benefits paid to persons after age 61, it omits some benefits funded by payroll taxes, for example, young survivors who receive benefits. It also omits OASI benefits after age 61 that are shared by a younger spouse. Consequently, the payroll taxes needed to fund OASI benefits after age 61 are somewhat overestimated.
8. Calculations assume a real discount rate of 2.7 percent. No sensitivity tests have been performed to examine how the discount rate assumption affects the results.
9. For couples, this is based on a joint and survivor annuity of the couple's wealth from age 62 until the projected death dates of both husband and wife. Each partner receives half of the income while both are alive, and the survivor receives the survivor pension until death.
10. The same is done for husbands when they are the younger spouse.
11. Aggregate payroll taxes and benefits from OASI differ slightly between the individual and the shared lifetime covered earnings measures. The shared measure includes earnings shared by imputed spouses who may not be in the MINT2 sample, whereas the individual measure includes earnings only for workers in the MINT sample. Thus, the overall universe for counting earnings differs.
12. Individuals cannot actually buy an annuity that yields this benefit flow in today's market. Moreover, the age-adjusted annuity calculations do not reflect any utility loss associated with the risk of outliving one's assets.
References
Aaron, Henry J. 1977. "Demographic Effects on the Equity of Social Security Benefits." In The Economics of Public Services, edited by M.S. Feldstein and R.P. Inman. New York: MacMillan and Company, pp. 151–173.
Bosworth, Barry ; Gary Burtless; and Claudia Sahm. 2001. The Trend in Lifetime Earnings Inequality and Its Impact on the Distribution of Retirement Income. Report No. 15. Boston, Mass.: Boston College Consortium on Retirement Research.
Butrica, Barbara A., and Howard M. Iams. 1999. "Projecting Retirement Income of Future Retirees with Panel Data: Results from the Modeling Income in the Near Term (MINT) Project." Social Security Bulletin 62(4): 3–8.
________. 2000a. "Divorced Women at Retirement: Projections of Economic Well-Being in the Near Future." Social Security Bulletin 63(3): 3–13.
________. 2000b. "Never Married Women Reaching Retirement: A Case of Economic Vulnerability." Paper presented at the Annual Meeting of the American Sociological Association. Washington, D.C. August.
Butrica, Barbara A.; Howard M. Iams; James H. Moore; and Mikki D. Waid. 2001. Methods in Modeling Income in the Near Term (MINT). ORES Working Paper No. 91. Washington, D.C.: Social Security Administration, Office of Policy, Office of Research, Evaluation, and Statistics.
Butrica, Barbara A.; Howard M. Iams; and Steven H. Sandell. 1999. "Using Data for Couples to Project the Distributional Effects of Changes in Social Security Policy." Social Security Bulletin 62(3): 20–27.
Clarke, Sally C. 1995. "Advance Report of Final Divorce Statistics, 1989 and 1990." Monthly Vital Statistics Report 43(9), Supplement (March). Hyattsville, Md.: National Center for Health Statistics.
Coronado, Julia Lynn; Don Fullerton; and Thomas Glass. 2000. The Progressivity of Social Security. NBER Working Paper No. 7520. Cambridge, Mass.: National Bureau of Economic Research.
Duggan, James E.; Robert Gillingham; and John S. Greenlees. 1993. "Progressive Returns to Social Security? An Answer from Social Security Records." Paper presented at the Econometric Society, Anaheim, California, January 5.
Fullerton, Howard N., Jr. 1999. "Labor Force Participation: 75 Years of Change, 1950–98 and 1998–2025." Monthly Labor Review 122(12): 3–12.
Goldstein, Joshua R. 1999. "The Leveling of Divorce in the United States." Demography 36(3): 409–414.
Gustman, Alan L., and Thomas L. Steinmeier. 2000. "How Effective Is Redistribution Under the Social Security Benefit Formula?" Paper presented at the Second Annual Joint Conference for the Retirement Research Consortium, Washington, D.C., May 17–18.
Hayghe, Howard V. 1990. "Family Members in the Work Force." Monthly Labor Review (March): 14–19.
________. 1993. "Working Wives' Contributions to Family Incomes." Monthly Labor Review (August): 39–43.
________. 1997. "Developments in Women's Labor Force Participation." Monthly Labor Review (September): 41–46.
Iams, Howard M., and Steven H. Sandell. 1997. "Projecting Social Security Earnings: Past Is Prologue." Social Security Bulletin 60(2): 3–16.
Lynch, Scott M., and J. Scott Brown. 2001. "Reconsidering Mortality Compression and Deceleration: An Alternative Model of Mortality Rates." Demography 38(1): 79–97.
Panis, Constantijn, and Lee Lillard. 1999. Near Term Model Development. Final Report. SSA Contract No. 600-96-27335. Santa Monica, Calif.: RAND.
Social Security Administration. 2001. Social Security Handbook: Your Basic Guide to the Social Security Programs. 14th ed. Washington, D.C.: Government Printing Office.
Toder, Eric; Cori Uccello; John O'Hare; Melissa Favreault; Caroline Ratcliffe; Karen Smith; Gary Burtless; and Barry Bosworth. 1999. "Modeling Income in the Near Term—Projections of Retirement Income Through 2020 for the 1931–1960 Birth Cohorts Final Report." SSA Contract No. 600-96-27332. Washington, D.C.: Urban Institute and Brookings Institution.
Wetzel, James R. 1990. "American Families: 75 Years of Change." Monthly Labor Review (March): 4–13.
Zayatz, Tim. 1999. "Social Security Disability Insurance Program Worker Experience." Actuarial Study No. 114. Baltimore, Md.: Office of the Chief Actuary, Social Security Administration. June.