DI & SSI Program Participants: Characteristics & Employment, 2015
- About This
Chartbook - Work Activity Before
and After Award - Employment Expectations
and Characteristics - Employment
Services - Factors Related
to Employment - Further
Resources - Appendix
and Glossary
About This Chartbook
Data Sources
This publication uses data from the 2015 National Beneficiary Survey (NBS) and 2015 Disability Analysis File (DAF15) linked to the Master Earnings File (MEF).
NBS
The 2015 NBS collected data from 4,062 DI beneficiaries and SSI recipients aged 18 to full retirement age (FRA). Respondents included DI workers, disabled adult children, and disabled widow(er)s as well as SSI blind and disabled recipients. Survey respondents are a representative sample of beneficiaries and recipients from all 50 states and the District of Columbia who were in current-pay status as of June 2014. Data collection began in February 2015 and ended in October 2015. More information on the NBS is available at https://www.ssa.gov
DAF
The DAF15 is a longitudinal data file that contains SSA administrative data. It includes detailed information about DI beneficiaries and SSI recipients aged 18 to FRA who have received disability benefits in any month between March 1996 and December 2015. It includes DI workers, disabled adult children, and disabled widow(er)s as well as SSI blind and disabled recipients. It also includes data on SSI child recipients aged 10–17 who have received benefits in any month between January 2005 and December 2015. More information on the DAF is available at https://www.ssa.gov
MEF
Each year, SSA receives Internal Revenue Service (IRS) records containing work and earnings information for U.S. workers. SSA stores this information as the MEF. The MEF contains data derived from IRS Form W-2 and annual income tax forms (Form 1040 Schedule SE), including regular wages and salaries, tips, self-employment income, and deferred compensation. The DAF includes a version of the MEF for disability-program beneficiaries. More information on the DAF MEF is available at the DAF website above. Use of the DAF MEF is restricted to SSA staff.
Data Notes
Weights
All NBS statistics are weighted to represent the national adult DI beneficiary and SSI recipient population.
Employment
In the NBS, employed individuals are those who worked at a job or business for pay or profit at the time of the interview.
Earnings
All earnings are converted to 2015 dollars using the Consumer Price Index for Urban Wage Earners and Clerical Workers (CPI-W). When we compare earnings to substantial gainful activity (SGA) level, we use the 2015 non-blind SGA amount ($1,090 per month).
Data for individuals with MEF earnings above $1 million a year are excluded. Individuals with missing MEF earnings are considered to have no earnings.
Unless otherwise noted, average earnings include those with no earnings.
Cohorts
Many of the charts that are based on DAF data use an award cohort to examine beneficiaries' and recipients' activity before and/or after award. Beneficiaries and recipients are included in the award cohort if they received their first payment as an adult in that year. SSI recipients who previously received child benefits are included if they were newly entitled as an adult in the year of the cohort. Charts that use an award cohort exclude beneficiaries and recipients in pre-award years in which they were younger than 16 and post-award years in which they had reached FRA, died, or were no longer a beneficiary or recipient for a reason other than work. Most charts use the 2007 award cohort. We chose this cohort to have sufficient data on beneficiaries and recipients before and after award and to avoid cohorts awarded benefits during the Great Recession. Some charts use the 2001 cohort to allow a longer follow-up period.
For the award cohort charts, the program (DI only, SSI only, and concurrent DI and SSI) is determined as of December of the award cohort year; beneficiaries and recipients in current-pay status or suspension or termination status because of work are counted.
Suspensions or terminations
Estimates of suspension or termination of benefits because of work come from DAF variables constructed using information on program status, benefit payment, income, and other work indicators.
Benefits forgone for work
Estimates of benefits forgone for work come from DAF variables that calculate the inflation-adjusted cash benefits given up each month when beneficiaries or recipients start working and reduce their reliance on SSA program benefits. This measure is the sum of the dollar values of the monthly cash benefits the beneficiaries or recipients would have received if their benefits had not been reduced, suspended, or terminated because of work.
Measures of both suspension and termination for work and benefits forgone for work exclude months in which beneficiaries or recipients are ineligible for benefits for reasons other than work, including medical recovery, excess resources (for SSI), death, and retirement. Although both measures are imperfect, we believe they provide reasonable estimates of suspensions and terminations for work and of the cash benefits forgone as a result of work activity. For more information, see https://www.ssa.gov
Ticket to Work
For Ticket to Work (TTW) charts, we split ticket assignments into two groups based on employment service type: those who received services from a state vocational rehabilitation agency (SVRA) under SSA's traditional reimbursement (whether formally or informally assigned) and those who received services from an SVRA or an employment network (EN) under SSA's milestone-outcome or outcome-only payment systems. SVRAs can choose whether to serve clients under traditional reimbursement or one of the EN payment systems on a case-by-case basis. More information on TTW payment systems for SVRAs and ENs is available at https://yourtickettowork.ssa.gov.
Program Notes
Social Security work incentives
The DI and SSI programs offer a number of employment support provisions commonly referred to as “work incentives.” These rules offer tools that beneficiaries can use to reduce their “countable” earnings to temporarily keep cash benefits while initially exploring work. Work incentives help beneficiaries enter, re-enter, or continue in employment by protecting their eligibility for cash payments and/or health care coverage until they achieve self-supporting employment.
The work incentives include a range of SSA-funded employment services through the Ticket to Work program. Services include consultation with a benefits specialist on how work affects benefits, the exclusion of earnings in determining continued eligibility for cash benefits, access to health care while working (even for long periods after cash benefits end), and streamlined benefit reinstatement if the work attempt eventually fails. Some work incentives are available to SSI recipients only, some are available to DI beneficiaries only, and some are offered to both SSI and DI beneficiaries. For detailed information on Social Security work incentives, see “The Social Security Red Book–A Summary Guide to Employment Supports for Persons with Disabilities under the Social Security Disability Insurance and Supplemental Security Income Programs” at https://www.ssa.gov/redbook/.
Insured status for Social Security Disability Insurance
Congress designed the DI program to provide income protection for individuals with a demonstrated work-limiting disability and a qualifying work and earnings history. To be insured for DI benefits, a worker must make payroll-tax contributions to Social Security and earn work credits by accruing earnings that meet or exceed statutory thresholds. Since 1978, the threshold has been adjusted annually for inflation. In 2020, the earnings threshold for one credit is $1,410. A worker can accrue a maximum of four credits in a calendar year, without regard to when the work occurred during the year. For example, in 2020, workers who earn at least $1,410, $2,820, $4,230, or $5,640 respectively earn one, two, three, or four work credits for the year. Workers are generally insured for benefits if they have worked and earned at least one-fourth of the maximum possible work credits since reaching age 21 and at least half of the maximum possible work credits in the 10 years before disability onset. (The latter requirement is proportionally reduced for workers younger than 31.)
Insured status is also generally extended to the disabled adult children and disabled spouses of workers who have insured status and receive DI or retirement benefits, or have died.
Medicare eligibility for DI beneficiaries
Medicare Part A is Hospital Insurance. Most people do not have to pay for Part A. Part B is Supplementary Medical Insurance. Most people pay a monthly premium for Part B. Everyone who is eligible for DI benefits is also eligible for Medicare after a 24-month qualifying (waiting) period. SSA counts 1 month for each month of disability benefit entitlement. SSA also counts months in previous periods of disability under any of the three following conditions:
- the current disabling impairment is the same as, or directly related to, the impairment on which the previous entitlement was based;
- the new disability begins within 60 months of the end of a prior DI disabled-worker benefit entitlement; or
- the new disability begins within 84 months of the end of disabled widow(er) or childhood disability benefits.
DI beneficiaries with Medicare coverage may receive at least 93 months of Hospital Insurance and Supplementary Medical Insurance after completing their trial work period as long as they still have a disabling impairment, even if cash benefits cease. The beneficiary does not pay a premium for Hospital Insurance during this time, which is known as the extended period of Medicare eligibility. After premium-free Medicare coverage ends because of work, beneficiaries can purchase Medicare Hospital Insurance and Supplementary Medical Insurance if they continue to have a disability at the end of the 93-month period. This provision is known as Medicare for the Working Disabled.
Medicaid eligibility
Medicaid is a jointly funded federal-state health insurance program for low-income and needy people. It covers children and aged, blind, and/or disabled people who are eligible to receive federally assisted income maintenance payments.
Thirty-two states and the District of Columbia provide Medicaid eligibility to people who are eligible for SSI payments. In these states, the SSI application is also the Medicaid application. Medicaid eligibility starts in the same month as SSI eligibility.
Alaska, Idaho, Kansas, Nebraska, Nevada, Oregon, Utah, and the Northern Mariana Islands use the same rules to determine Medicaid eligibility that SSA uses for SSI, but those jurisdictions require the SSI applicant to file a separate Medicaid application. Connecticut, Hawaii, Illinois, Indiana, Minnesota, Missouri, New Hampshire, North Dakota, Ohio, Oklahoma, and Virginia use their own Medicaid eligibility rules, which differ from SSA's rules for SSI eligibility. These states also require an SSI applicant to file a separate application for Medicaid.
In states that provide Medicaid coverage to SSI recipients, a recipient who starts working will retain Medicaid coverage for as long as the disabling condition continues. This is true even if the recipient's earnings, along with other income, become too high to receive ongoing SSI payments. In this case, Medicaid coverage will continue if the recipient:
- is still blind or has a disability;
- has been eligible for an SSI cash payment for at least 1 month;
- was eligible for Medicaid in the month before earnings exceeded the limit for receiving an SSI cash payment;
- still met all other SSI eligibility rules (including the resources test) except those pertaining to earnings;
- needs Medicaid in order to work (known as the Medicaid use test); and
- has gross earned income that is insufficient to replace SSI, Medicaid, and any publicly funded attendant care (known as the Medicaid threshold test).
In such cases, the recipient enters SSI special recipient status, also known as 1619(b) continued Medicaid coverage. As long as these conditions are met, the recipient can remain eligible for Medicaid indefinitely.
Work Activity Before and After Award
Last Year of Employment
Consistent with the fact that SSI does not require a work history, half of SSI-only recipients have never worked or last worked more than 5 years before award. Almost half of concurrent DI and SSI beneficiaries and 60 percent of DI-only beneficiaries worked in the year prior to award. More than 40 percent of beneficiaries and recipients aged 18–29 have never worked.
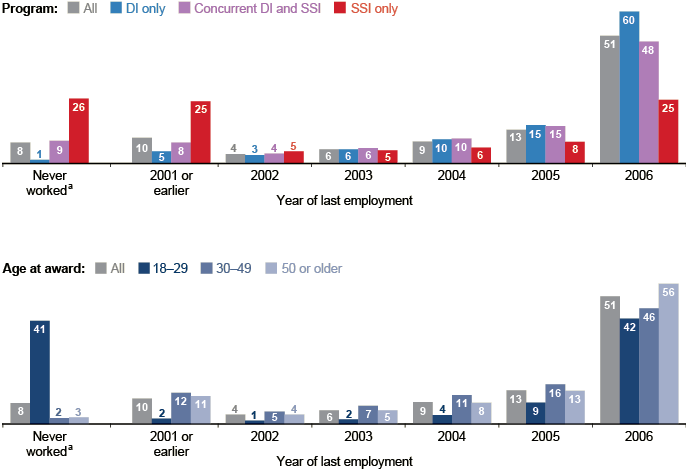
| Group | Never worked a | Year of last employment | |||||
|---|---|---|---|---|---|---|---|
| 2001 or earlier | 2002 | 2003 | 2004 | 2005 | 2006 | ||
| All | 8 | 10 | 4 | 6 | 9 | 13 | 51 |
| Program | |||||||
| DI only | 1 | 5 | 3 | 6 | 10 | 15 | 60 |
| Concurrent DI and SSI | 9 | 8 | 4 | 6 | 10 | 15 | 48 |
| SSI only | 26 | 25 | 5 | 5 | 6 | 8 | 25 |
| Age at award | |||||||
| 18–29 | 41 | 2 | 1 | 2 | 4 | 9 | 42 |
| 30–49 | 2 | 12 | 5 | 7 | 11 | 16 | 46 |
| 50 or older | 3 | 11 | 4 | 5 | 8 | 13 | 56 |
Earnings Before Award and Age at Award
More than half of all beneficiaries and recipients (54 percent) had earnings at or above the annualized SGA level in the 5th year before benefit award. Twenty-four percent of beneficiaries and recipients had earnings below the annualized SGA level and 23 percent had no earnings at all in the 5th year before award. SSI-only recipients and concurrent DI and SSI beneficiaries were much more likely to have no earnings or to be earning below the annualized SGA level in the 5th year before award than were DI-only beneficiaries. This is consistent with program definitions, and is likely partly because of their younger age at award: individuals aged 18–29 at the time of their benefit award made up more than one-third of SSI-only recipients and about one-quarter of concurrent DI and SSI beneficiaries, compared with only 5 percent of DI-only beneficiaries.

| Earnings in the 5th year before award | All | DI only | Concurrent DI and SSI | SSI only |
|---|---|---|---|---|
| No earnings | 22.6 | 10.1 | 24.1 | 66.0 |
| Less than SGA level | 23.9 | 19.9 | 48.1 | 26.4 |
| At least SGA level | 53.5 | 69.9 | 27.8 | 7.6 |

| Age at award | All | DI only | Concurrent DI and SSI | SSI only |
|---|---|---|---|---|
| 18–29 | 14.5 | 5.0 | 24.8 | 36.3 |
| 30–49 | 30.8 | 30.2 | 41.1 | 28.0 |
| 50 or older | 54.7 | 64.8 | 34.1 | 35.7 |
Employment and Earnings Before and After Award
Employment rates began to decline 6 years before benefit award and leveled off (at a much lower level) after award. Average earnings (bottom panel) followed a similar pattern. SSI-only recipients had a much lower employment rate 10 years before award than DI-only and concurrent DI and SSI beneficiaries: about 40 percent for SSI only, compared with about 90 percent for DI only and 75 percent for concurrent DI and SSI beneficiaries.

| Year | All | DI only | Concurrent DI and SSI | SSI only |
|---|---|---|---|---|
| 1997 | 80.6 | 92.0 | 74.8 | 41.1 |
| 1998 | 81.6 | 92.8 | 77.7 | 41.8 |
| 1999 | 81.9 | 93.1 | 79.4 | 41.9 |
| 2000 | 82.1 | 93.2 | 80.7 | 42.2 |
| 2001 | 80.4 | 92.3 | 79.0 | 38.5 |
| 2002 | 77.4 | 89.9 | 75.9 | 34.0 |
| 2003 | 73.8 | 86.6 | 72.0 | 30.6 |
| 2004 | 69.2 | 81.6 | 67.7 | 28.4 |
| 2005 | 59.3 | 72.6 | 57.9 | 24.2 |
| 2006 | 50.6 | 60.2 | 48.4 | 25.2 |
| 2007 | 32.5 | 36.8 | 32.1 | 20.7 |
| 2008 | 16.4 | 16.9 | 18.1 | 13.9 |
| 2009 | 13.2 | 13.4 | 15.3 | 11.4 |
| 2010 | 13.0 | 13.1 | 15.3 | 11.5 |
| 2011 | 12.8 | 12.6 | 15.4 | 11.8 |
| 2012 | 12.9 | 12.7 | 15.5 | 12.0 |
| 2013 | 13.3 | 13.0 | 16.0 | 12.7 |
| 2014 | 13.8 | 13.2 | 16.8 | 13.8 |
| 2015 | 14.7 | 13.8 | 17.9 | 14.9 |

| Year | All | DI only | Concurrent DI and SSI | SSI only |
|---|---|---|---|---|
| 1997 | 24,281 | 31,577 | 8,891 | 3,851 |
| 1998 | 25,260 | 32,909 | 9,814 | 3,824 |
| 1999 | 25,609 | 33,411 | 10,403 | 3,829 |
| 2000 | 25,684 | 33,578 | 10,745 | 3,770 |
| 2001 | 24,805 | 32,593 | 10,253 | 3,451 |
| 2002 | 23,372 | 30,944 | 9,390 | 2,962 |
| 2003 | 21,559 | 28,735 | 8,440 | 2,605 |
| 2004 | 19,373 | 26,035 | 7,518 | 2,298 |
| 2005 | 15,060 | 21,341 | 5,779 | 1,633 |
| 2006 | 10,356 | 14,437 | 4,098 | 1,457 |
| 2007 | 3,067 | 4,129 | 1,578 | 888 |
| 2008 | 1,163 | 1,435 | 809 | 514 |
| 2009 | 1,067 | 1,285 | 832 | 514 |
| 2010 | 1,057 | 1,257 | 870 | 539 |
| 2011 | 1,102 | 1,302 | 938 | 607 |
| 2012 | 1,178 | 1,383 | 1,028 | 685 |
| 2013 | 1,290 | 1,504 | 1,146 | 789 |
| 2014 | 1,416 | 1,624 | 1,310 | 934 |
| 2015 | 1,628 | 1,836 | 1,560 | 1,144 |
| NOTE: Annualized SGA level = $13,080. | ||||
Earnings Before Award Compared with Benefits and Earnings After Award
For DI-only beneficiaries, average benefits plus earnings in the 2nd year after award totaled $17,175, or about 56 percent of their average earnings in the 5th year before award ($30,944). SSI-only recipients and concurrent DI and SSI beneficiaries had lower benefit and earnings amounts after award, yet the totals exceeded their earnings before award. SSI-only recipients averaged $9,080 in benefits plus earnings in the 2nd year after award, more than 300 percent of their average earnings in the 5th year before award ($2,962). This is largely because SSI-only recipients were more likely to have had no earnings or to be earning below the SGA level before benefit award, as illustrated in an earlier chart.
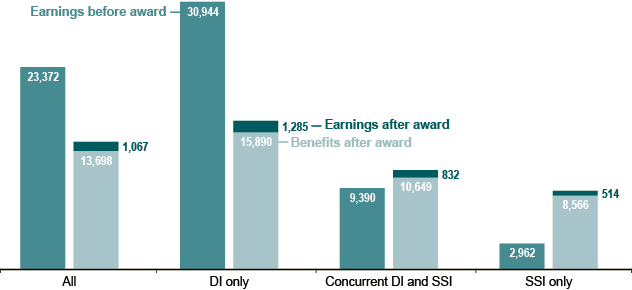
| Characteristic | All | DI only | Concurrent DI and SSI | SSI only |
|---|---|---|---|---|
| Earnings before award | 23,372 | 30,944 | 9,390 | 2,962 |
| After award | ||||
| Benefits | 13,698 | 15,890 | 10,649 | 8,566 |
| Earnings | 1,067 | 1,285 | 832 | 514 |
Employment Status and Earnings After Award
By the 5th year after benefit award, the vast majority of beneficiaries and recipients (91 percent) either did not work or had died or reached full retirement age. Most of those who were working in the 5th year after award earned small amounts each month, on average. Less than 2 percent of beneficiaries and recipients worked and earned more than the SGA level.
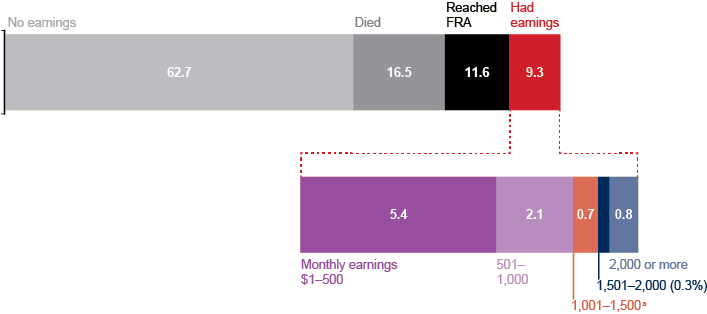
| Status | Percent |
|---|---|
| No earnings | 62.7 |
| Died | 16.5 |
| Reached FRA | 11.6 |
| Had earnings | 9.3 |
| $1–500 | 5.4 |
| $501–1,000 | 2.1 |
| $1,001–1,500 a | 0.7 |
| $1,501–2,000 | 0.3 |
| $2,000 or more | 0.8 |
Employment Milestones Within 5 Years After Award
About 22 percent of all beneficiaries and recipients, and 41 percent of those aged 18–29, worked at some point within 5 years following award. However, most of them earned below the annualized SGA level. About 4 percent of beneficiaries and recipients earned above the annualized SGA level at some point within the 5 years following award, and about 3 percent had their benefits suspended or terminated for at least 1 month because of work.
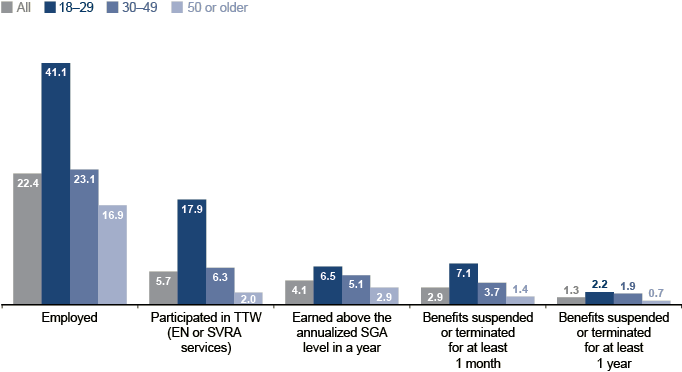
| Milestone | All | 18–29 | 30–49 | 50 or older |
|---|---|---|---|---|
| Employed | 22.4 | 41.1 | 23.1 | 16.9 |
| Participated in TTW (EN or SVRA services) | 5.7 | 17.9 | 6.3 | 2.0 |
| Earned above the annualized SGA level in a year | 4.1 | 6.5 | 5.1 | 2.9 |
| Benefits suspended or terminated for at least 1 month | 2.9 | 7.1 | 3.7 | 1.4 |
| Benefits suspended or terminated for at least 1 year | 1.3 | 2.2 | 1.9 | 0.7 |
Long-Term Employment Activity
When observed over 15 years, some SSI recipients and DI beneficiaries met employment milestones, with around 6 percent of SSI recipients and 5 percent of DI beneficiaries having cash benefits suspended because of work.
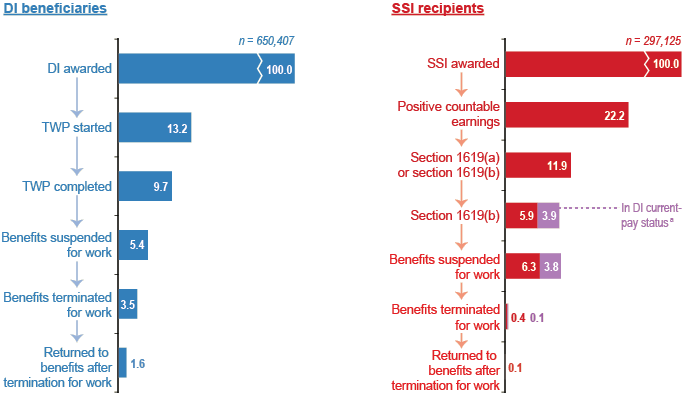
| Participant type and milestone | Percent |
|---|---|
| DI beneficiaries | |
| DI awarded (n = 650,407) | 100 |
| TWP started | 13.2 |
| TWP completed | 9.7 |
| Benefits suspended for work | 5.4 |
| Benefits terminated for work | 3.5 |
| Returned to benefits after termination for work | 1.6 |
| SSI recipients | |
| SSI awarded (n = 297,125) | 100 |
| Positive countable earnings | 22.2 |
| Section 1619(a) or section 1619(b) | 11.9 |
| Section 1619(b) and— | |
| Not in DI current-pay status a | 5.9 |
| In DI current-pay status a | 3.9 |
| Benefits suspended for work and— | |
| Not in DI current-pay status a | 6.3 |
| In DI current-pay status a | 3.8 |
| Benefits terminated for work and— | |
| Not in DI current-pay status a | 0.4 |
| In DI current-pay status a | 0.1 |
| Returned to benefits after termination for work | 0.1 |
Employment Expectations and Characteristics
Employment Expectations
About 45 percent of beneficiaries and recipients reported being “work-oriented,” meaning they said their goals included working or advancing in their careers or that they saw themselves working in the next 2 years or next 5 years. More than one-third of beneficiaries and recipients had work goals, while one-quarter saw themselves working in the next 2 years and 17 percent saw themselves working and earning enough to leave disability benefits in the next 5 years.
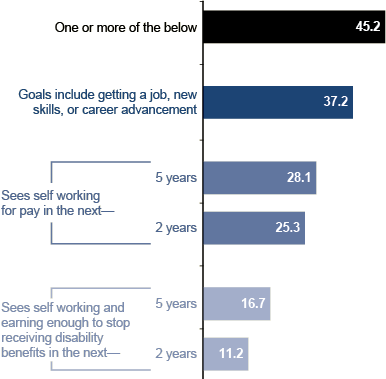
| Statement | Percent |
|---|---|
| One or more of the below | 45.2 |
| Goals include getting a job, new skills, or career advancement | 37.2 |
| Sees self working for pay in the next— | |
| 5 years | 28.1 |
| 2 years | 25.3 |
| Sees self working and earning enough to stop receiving disability benefits in the next— | |
| 5 years | 16.7 |
| 2 years | 11.2 |
Employment Rates and Hours
About 9 percent of DI-only and concurrent DI and SSI beneficiaries and 7 percent of SSI-only recipients reported working, compared with 27 percent of working-age persons with a disability and almost 70 percent of the working-age U.S. population. Of those employed, few beneficiaries and recipients worked full-time (35 hours or more per week). More than one-quarter of working beneficiaries and recipients worked 10 or fewer hours per week (right panel).
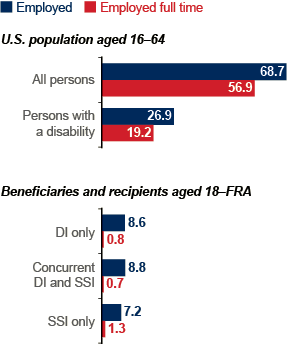
| Group | Employed | Employed full-time |
|---|---|---|
| U.S. population aged 16–64 | ||
| All persons | 68.7 | 56.9 |
| Persons with a disability | 26.9 | 19.2 |
| Beneficiaries and recipients aged 18–FRA | ||
| DI only | 8.6 | 0.8 |
| Concurrent DI and SSI | 8.8 | 0.7 |
| SSI only | 7.2 | 1.3 |
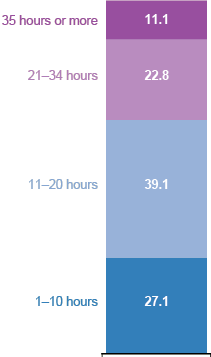
Employment Rates and Earnings by Education Level
The employment rate in 2015 for beneficiaries and recipients aged 25 or older was 10 percent for those with less than a high school education, 13 percent for those with a high school education, and almost 14 percent for those with more than a high school education, although those with a high school education had the highest median earnings ($6,366). Beneficiaries and recipients with a special education certificate of completion had a relatively high employment rate (19 percent) but low median annual earnings ($854), consistent with the fact that most of them worked in sheltered employment (not shown).
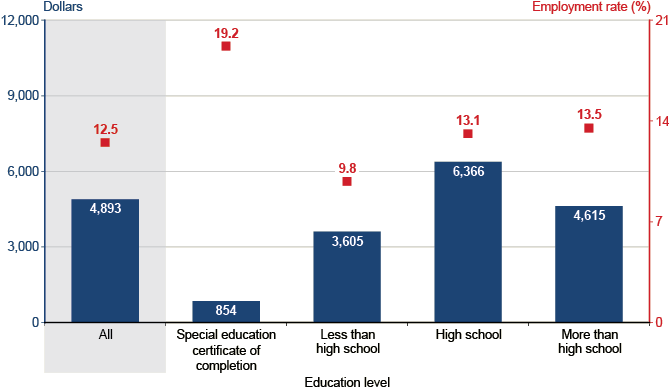
| Education level | Median annual earnings (dollars) | Employment rate (percent) |
|---|---|---|
| All | 4,893 | 12.5 |
| Special education certificate of completion | 854 | 19.2 |
| Less than high school | 3,605 | 9.8 |
| High school | 6,366 | 13.1 |
| More than high school | 4,615 | 13.5 |
Reservation Wages Compared with Actual Wages
Most nonworking beneficiaries and recipients had modest expectations of how much they would need to earn to accept a job (the reservation wage) relative to the actual wages of working beneficiaries and recipients. For example, 28 percent of nonworking respondents had a reservation wage of $10.00–$14.99 per hour while 35 percent of working beneficiaries and recipients were earning at that level. Some expectations were unsupported by actual earnings. More than one-fifth of nonworking beneficiaries and recipients expected to earn more than $15 per hour, yet only about one in 10 were earning at this level.
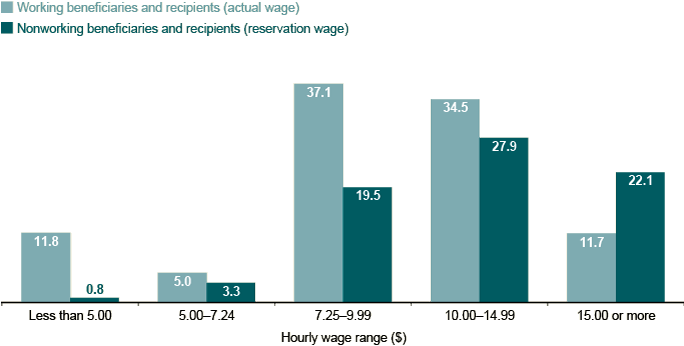
| Hourly wage range | Working beneficiaries and recipients (actual wage) | Nonworking beneficiaries and recipients (reservation wage) |
|---|---|---|
| Less than $5.00 | 11.8 | 0.8 |
| $5.00–7.24 | 5.0 | 3.3 |
| $7.25–9.99 | 37.1 | 19.5 |
| $10.00–14.99 | 34.5 | 27.9 |
| $15.00 or more | 11.7 | 22.1 |
Employer-Provided Benefits
Most working beneficiaries and recipients did not receive benefits from their employer. Only 19 percent received paid sick leave and 22 percent received employer-sponsored health insurance.
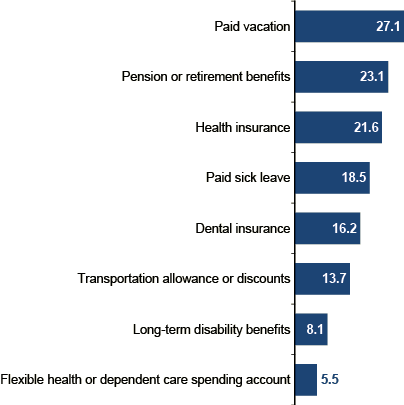
Occupation and Industry of Working Beneficiaries and Recipients
Working beneficiaries and recipients held a wide variety of occupations across a range of industries. The most common occupations included office and administrative support (21 percent) and building and grounds cleaning or maintenance (12 percent). By industry, 34 percent of beneficiaries worked in social assistance and about 16 percent worked in retail.
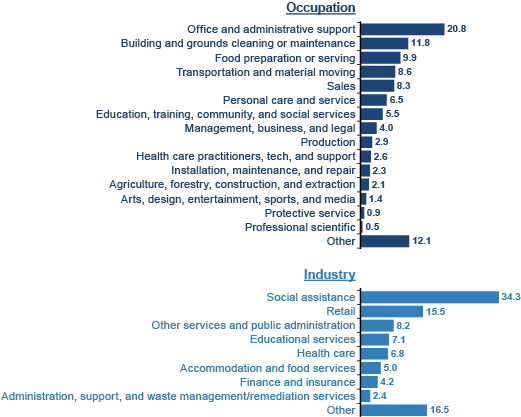
| Category | Percent |
|---|---|
| Occupation | |
| Office and administrative support | 20.8 |
| Building and grounds cleaning or maintenance | 11.8 |
| Food preparation or serving | 9.9 |
| Transportation and material moving | 8.6 |
| Sales | 8.3 |
| Personal care and services | 6.5 |
| Education, training, community, and social services | 5.5 |
| Management, business, and legal | 4.0 |
| Production | 2.9 |
| Health care practitioners, tech, and support | 2.6 |
| Installation, maintenance, and repair | 2.3 |
| Agriculture, forestry, construction, and extraction | 2.1 |
| Arts, design, entertainment, sports, and media | 1.4 |
| Protective service | 0.9 |
| Professional scientific | 0.5 |
| Other | 12.1 |
| Industry | |
| Social assistance | 34.3 |
| Retail | 15.5 |
| Other services and public administration | 8.2 |
| Educational services | 7.1 |
| Health care | 6.8 |
| Accommodation and food services | 5.0 |
| Finance and insurance | 4.2 |
| Administration, support, and waste management/remediation services | 2.4 |
| Other | 16.5 |
Employment Supports and Accommodations
About one-quarter of working beneficiaries and recipients worked in sheltered employment, one-quarter used special equipment at work, and 19 percent used personal assistance. More than half (56 percent) of working beneficiaries and recipients received at least one accommodation from their employer. The most common was an arrangement for co-workers or others to assist the beneficiary or recipient (used by 73 percent of those with accommodations), followed by changes to work tasks and work schedule (used by 50 percent each).
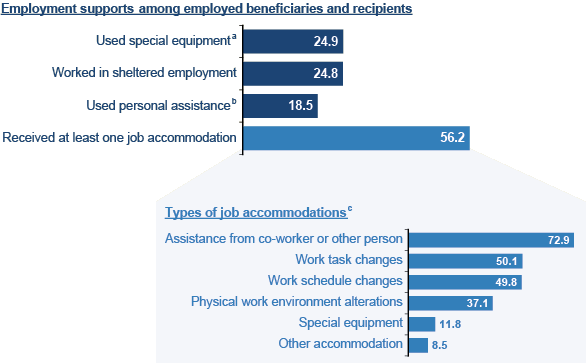
| Category | Percent |
|---|---|
| Support | |
| Used special equipment a | 24.9 |
| Worked in sheltered employment | 24.8 |
| Used personal assistance b | 18.5 |
| Received at least one job accomodation | 56.2 |
| Job accomodation c | |
| Assistance from co-worker or other person | 72.9 |
| Work task changes | 50.1 |
| Work schedule changes | 49.8 |
| Physical work environment alterations | 37.1 |
| Special equipment | 11.8 |
| Other accommodation | 8.5 |
Employment Services
Awareness of Social Security Work Incentives
Awareness of SSA work incentives was low among beneficiaries and recipients, especially of SSI work incentives. The most widely known work incentive was the trial work period, but only about one-third of DI beneficiaries had heard of it. About one-quarter of beneficiaries and recipients had heard of Ticket to Work. Less than 20 percent of beneficiaries and recipients reported awareness of each of the other work incentives. None of the SSI-only work incentives exceeded a 15 percent awareness rate.
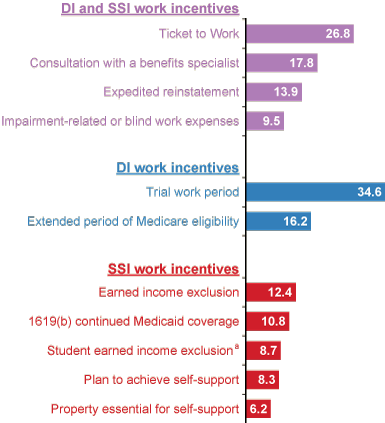
| Program and incentive | Percent |
|---|---|
| DI and SSI work incentives | |
| Ticket to Work | 26.8 |
| Consultation with a benefits specialist | 17.8 |
| Expedited reinstatement | 13.9 |
| Impairment-related or blind work expenses | 9.5 |
| DI work incentives | |
| Trial work period | 34.6 |
| Extended period of Medicare eligibility | 16.2 |
| SSI work incentives | |
| Earned income exclusion | 12.4 |
| 1619(b) continued Medicaid coverage | 10.8 |
| Student earned income exclusion a | 8.7 |
| Plan to achieve self-support | 8.3 |
| Property essential for self-support | 6.2 |
Ticket to Work Usage
Around 12 percent of beneficiaries and recipients had ever used Ticket to Work, and most (96 percent) assigned their ticket to an SVRA. Concurrent DI and SSI beneficiaries were more likely to assign their ticket than DI-only beneficiaries or SSI-only recipients: 18 percent of concurrent DI and SSI beneficiaries had ever used their ticket, compared with 13 percent of SSI-only recipients and 11 percent of DI-only beneficiaries. Younger beneficiaries and recipients were more likely to assign their ticket than older beneficiaries and recipients: one-quarter of those aged 18–29 had ever assigned their ticket, compared with 8 percent of those aged 50 or older.
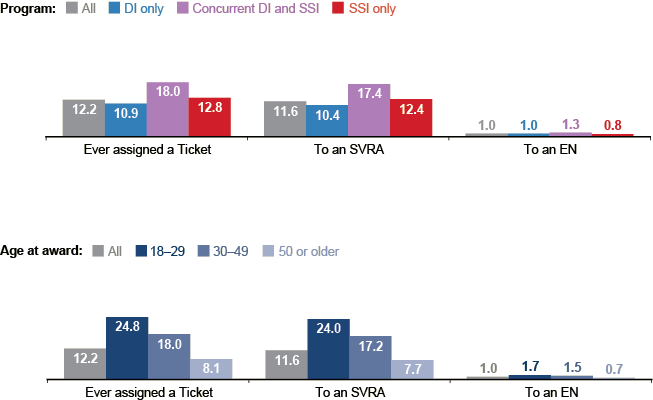
| Group | Ever assigned a Ticket | To an SVRA | To an EN |
|---|---|---|---|
| All | 12.2 | 11.6 | 1.0 |
| Program | |||
| DI only | 10.9 | 10.4 | 1.0 |
| Concurrent DI and SSI | 18.0 | 17.4 | 1.3 |
| SSI only | 12.8 | 12.4 | 0.8 |
| Age at award | |||
| 18–29 | 24.8 | 24.0 | 1.7 |
| 30–49 | 18.0 | 17.2 | 1.5 |
| 50 or older | 8.1 | 7.7 | 0.7 |
Employment Rate After Award and Service Usage
The small group of beneficiaries and recipients who used EN or SVRA services within 5 years after award experienced higher rates of employment than workers who did not use these services. The percentage working drops steadily for these groups over time, but in 2015 the employment rates for those who used services were still higher than the rate for those who worked but did not receive services by 2006.
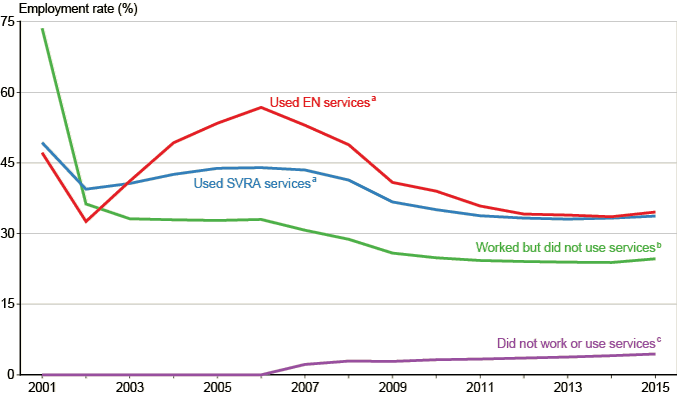
| Year | Used EN services a | Used SVRA services a | Worked but did not use services b | Did not work or use services c |
|---|---|---|---|---|
| 2001 | 47.1 | 49.2 | 73.6 | 0.0 |
| 2002 | 32.6 | 39.4 | 36.3 | 0.0 |
| 2003 | 41.1 | 40.6 | 33.1 | 0.0 |
| 2004 | 49.3 | 42.6 | 32.9 | 0.0 |
| 2005 | 53.4 | 43.8 | 32.8 | 0.0 |
| 2006 | 56.8 | 44.0 | 33.0 | 0.0 |
| 2007 | 53.0 | 43.5 | 30.7 | 2.2 |
| 2008 | 48.9 | 41.4 | 28.8 | 2.9 |
| 2009 | 40.8 | 36.7 | 25.9 | 2.8 |
| 2010 | 38.9 | 35.1 | 24.9 | 3.2 |
| 2011 | 35.9 | 33.7 | 24.3 | 3.3 |
| 2012 | 34.2 | 33.3 | 24.1 | 3.5 |
| 2013 | 33.9 | 33.1 | 23.9 | 3.8 |
| 2014 | 33.6 | 33.3 | 23.9 | 4.1 |
| 2015 | 34.6 | 33.7 | 24.6 | 4.4 |
Average Earnings After Award and Service Usage
Beneficiaries and recipients who used EN or SVRA services within 5 years after award started with lower average earnings than other working beneficiaries and recipients, but quickly surpassed the earnings of those who did not receive services (dashed lines). However, average earnings for all groups remained well below the annualized TWP and SGA levels. Average earnings among working beneficiaries and recipients increased over time for all groups (solid lines). Among those who had worked by year-end 2006, average earnings in 2015 were similar regardless of service use and were slightly higher than SGA level. For individuals who neither worked nor received services by 2006, 4 percent worked and had earnings in 2015, but their earnings were notably lower.
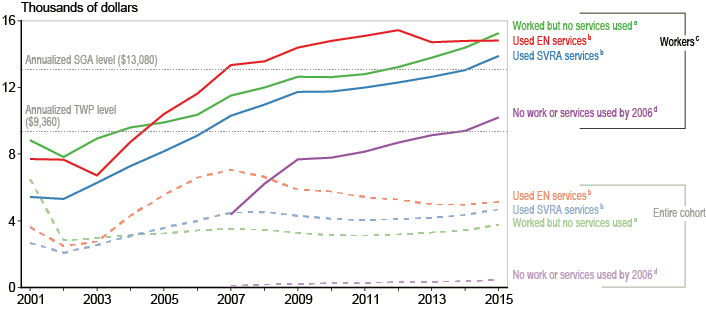
| Year | Entire cohort | Workers c | ||||||
|---|---|---|---|---|---|---|---|---|
| Worked but no services used a | Used EN services b | Used SVRA services b | No work or services used by 2006 d | Worked but no services used a | Used EN services b | Used SVRA services b | No work or services used by 2006 d | |
| 2001 | 6,497 | 3,627 | 2,672 | 0 | 8,832 | 7,697 | 5,426 | 0 |
| 2002 | 2,836 | 2,495 | 2,089 | 0 | 7,822 | 7,658 | 5,303 | 0 |
| 2003 | 2,962 | 2,760 | 2,550 | 0 | 8,940 | 6,713 | 6,274 | 0 |
| 2004 | 3,156 | 4,304 | 3,098 | 0 | 9,590 | 8,733 | 7,274 | 0 |
| 2005 | 3,243 | 5,554 | 3,578 | 0 | 9,888 | 10,392 | 8,167 | 0 |
| 2006 | 3,413 | 6,604 | 4,010 | 0 | 10,354 | 11,632 | 9,114 | 0 |
| 2007 | 3,527 | 7,063 | 4,479 | 95 | 11,499 | 13,333 | 10,302 | 4,373 |
| 2008 | 3,456 | 6,629 | 4,537 | 181 | 11,999 | 13,570 | 10,971 | 6,220 |
| 2009 | 3,267 | 5,869 | 4,300 | 218 | 12,630 | 14,382 | 11,723 | 7,693 |
| 2010 | 3,138 | 5,761 | 4,120 | 247 | 12,621 | 14,791 | 11,753 | 7,778 |
| 2011 | 3,105 | 5,414 | 4,044 | 273 | 12,797 | 15,093 | 11,984 | 8,149 |
| 2012 | 3,177 | 5,270 | 4,091 | 308 | 13,209 | 15,426 | 12,297 | 8,691 |
| 2013 | 3,298 | 4,995 | 4,178 | 344 | 13,783 | 14,717 | 12,640 | 9,125 |
| 2014 | 3,430 | 4,959 | 4,339 | 384 | 14,376 | 14,780 | 13,027 | 9,403 |
| 2015 | 3,753 | 5,119 | 4,675 | 450 | 15,258 | 14,816 | 13,888 | 10,208 |
| NOTE: Annualized SGA level = $13,080; annualized TWP level = $9,360. | ||||||||
Service Costs and Benefit Reductions for Ticket to Work Users and Non-Users
Beneficiaries and recipients who received TTW services from an SVRA or EN had greater benefit reductions on average over time than those who did not receive TTW services, thus generating benefit reductions for SSA. After deducting SSA administrative costs and SVRA or EN service payments, SVRA service users had an average of $17,768 in net benefit reductions because of their work activity, while EN service users had an average of $25,642 in net benefit reductions.
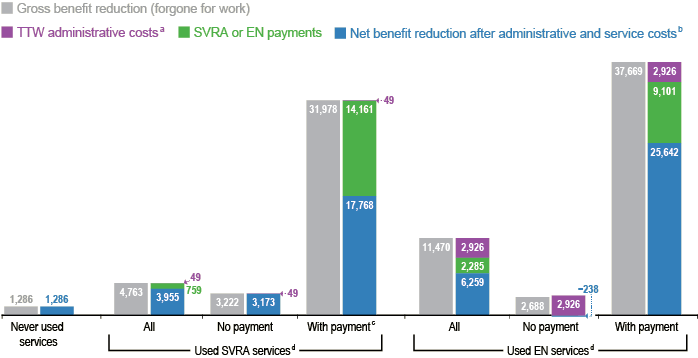
| Service usage | Gross benefit reduction (forgone for work) | TTW administrative costs a | SVRA or EN payments | Net benefit reduction after administrative and service costs b |
|---|---|---|---|---|
| Never used services | 1,286 | 0 | 0 | 1,286 |
| Used SVRA services d | 4,763 | 49 | 759 | 3,955 |
| No payment | 3,222 | 49 | 0 | 3,173 |
| With payment c | 31,978 | 49 | 14,161 | 17,768 |
| Used EN services d | 11,470 | 2,926 | 2,285 | 6,259 |
| No payment | 2,688 | 2,926 | 0 | -238 |
| With payment | 37,669 | 2,926 | 9,101 | 25,642 |
Factors Related to Employment
Reasons for Not Working
About 92 percent of beneficiaries and recipients were not working at the time of the survey interview, and most of them (90 percent) said they could not work because of their physical or mental conditions. Other reasons for not working included the lack of accessible workplaces, discouragement from previous attempts, and the inability to find a job the beneficiary or recipient qualified for.
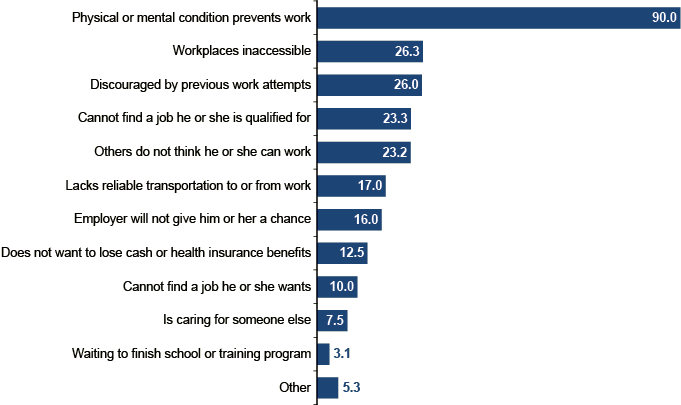
| Reason | Percent |
|---|---|
| Physical or mental condition prevents work | 90.0 |
| Workplaces inaccessible | 26.3 |
| Discouraged by previous work attempts | 26.0 |
| Cannot find a job he or she is qualified for | 23.3 |
| Others do not think he or she can work | 23.2 |
| Lacks reliable transportation to or from work | 17.0 |
| Employer will not give him or her a chance | 16.0 |
| Does not want to lose cash or health insurance benefits | 12.5 |
| Cannot find a job he or she wants | 10.0 |
| Is caring for someone else | 7.5 |
| Waiting to finish school or training program | 3.1 |
| Other | 5.3 |
Difficulty with Specific Activities
More than half (54 percent) of beneficiaries and recipients reported difficulty with activities of daily living, such as getting into or out of bed or bathing or dressing. A higher percentage (61 percent) reported difficulty with instrumental activities of daily living, such as getting around outside the home or preparing meals.
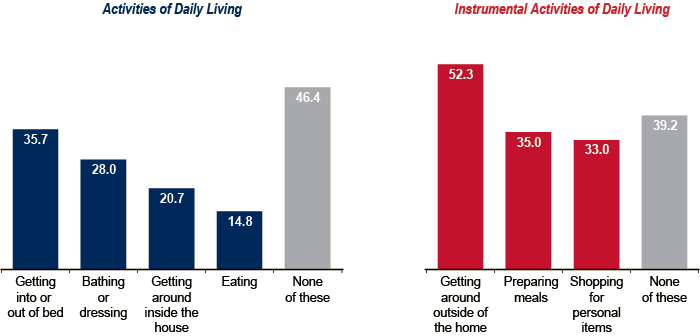
| Type | Percent |
|---|---|
| Activity of daily living | |
| Getting into or out of bed | 35.7 |
| Bathing or dressing | 28.0 |
| Getting around inside the house | 20.7 |
| Eating | 14.8 |
| None of these | 46.4 |
| Instrumental activity of daily living | |
| Getting around outside of the home | 52.3 |
| Preparing meals | 35.0 |
| Shopping for personal items | 33.0 |
| None of these | 39.2 |
General Health and Insurance Status
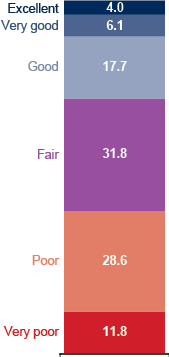
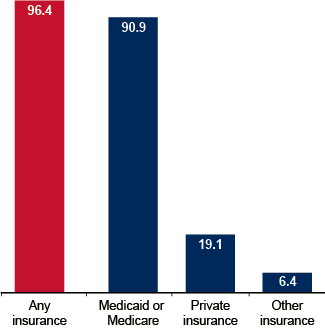
Most beneficiaries and recipients (60 percent) rated their health during the month preceding the survey as fair or poor. More than one-quarter rated their health as good, very good, or excellent. Almost all beneficiaries and recipients (96 percent) were covered by health insurance, with the vast majority (91 percent) covered by Medicare or Medicaid. Less than 20 percent had private insurance coverage.
Further Resources
National Beneficiary Survey
Disability Analysis File
Work Incentives
Past Research
- Stapleton, David, Su Liu, Dawn Phelps, and Sarah Prenovitz. “Work Activity and Use of Employment Supports Under the Original Ticket to Work Regulations: Longitudinal Statistics for New Social Security Disability Insurance Beneficiaries.” Washington, DC: Mathematica Policy Research, 2010.
- Ben-Shalom, Yonatan, David Stapleton, Dawn Phelps, and Maura Bardos. “Longitudinal Statistics for New Supplemental Security Income Beneficiaries.” Washington, DC: Mathematica Policy Research, 2012.
Appendix
Population Counts
To provide context for charts presenting percentages of DI beneficiaries and SSI recipients with selected characteristics, this table provides the underlying population counts.
| Characteristic | Bureau of Labor Statistics, 2015 | NBS, 2015 (weighted) | DAF | |||
|---|---|---|---|---|---|---|
| DI beneficiaries and SSI recipients in— | Award cohort | |||||
| 2015 | 2006 | 2007 | 2001 a | |||
| U.S. population aged 16–64 | ||||||
| Total | 204,292,000 | . . . | . . . | . . . | . . . | . . . |
| Persons with a disability | 15,771,000 | . . . | . . . | . . . | . . . | . . . |
| DI beneficiaries and SSI recipients | . . . | 12,896,735 | 13,557,714 | . . . | 972,068 | 880,530 |
| Program participation | ||||||
| DI only | . . . | 7,347,758 | 8,592,683 | . . . | 639,731 | . . . |
| SSI only | . . . | 3,604,355 | 3,563,591 | . . . | 233,617 | . . . |
| Concurrent DI and SSI | . . . | 1,944,622 | 1,401,440 | . . . | 98,720 | . . . |
| Age group | ||||||
| 18–29 | . . . | . . . | 1,152,869 | . . . | 141,281 | . . . |
| 30–49 | . . . | . . . | 3,631,466 | . . . | 298,987 | . . . |
| 50 or older | . . . | . . . | 8,773,379 | . . . | 531,800 | . . . |
| Use of services | ||||||
| Used EN services | . . . | . . . | . . . | 4,302 | . . . | 1,218 |
| No payment | . . . | . . . | . . . | 3,222 | . . . | . . . |
| With payment | . . . | . . . | . . . | 1,080 | . . . | . . . |
| Used SVRA services | . . . | . . . | . . . | 135,109 | . . . | 55,332 |
| No payment | . . . | . . . | . . . | 127,869 | . . . | . . . |
| With payment | . . . | . . . | . . . | 7,240 | . . . | . . . |
| Never used services | . . . | . . . | . . . | 10,996,326 | . . . | . . . |
| Worked but did not use services | . . . | . . . | . . . | . . . | . . . | 247,737 |
| Did not work or use services | . . . | . . . | . . . | . . . | . . . | 348,211 |
| Died b | . . . | . . . | . . . | . . . | . . . | 144,151 |
| Reached FRA b | . . . | . . . | . . . | . . . | . . . | 83,881 |
| Referenced on chartbook page(s)— | 13 | c 13–14 | 14, 20 | 23 | 5–10 | 21–22 |
| NOTE: . . . = not applicable. | ||||||
| a. Counts by service-use category are as of 2006. | ||||||
| b. Not shown in this chartbook. | ||||||
| c. Charts that refer to specfic tables in National Beneficiary Survey: Disability Statistics, 2015 are not listed here because those tables include population counts. | ||||||
Glossary
1619(a). Continuation of SSI benefits for disabled individuals whose gross earned income is at or above SGA level. All other eligibility rules still apply. Also known as special cash payment.
1619(b) continued Medicaid coverage. For Medicaid purposes, provides special status to working disabled or blind individuals when their earnings make them ineligible for SSI cash payments. Also known as special recipient status.
award cohort. A group of recipients or beneficiaries who received their first SSI or DI payment as an adult in a given year. There is frequently a gap between the first month of eligibility and first month of payment because of the time it takes to make a determination that the beneficiary is disabled. We use first payment month rather than first eligibility month because it is the earliest month at which eligibility affects the awardee financially.
benefits specialist. An individual who works at a Work Incentives Planning and Assistance program, which is a local organization that gives beneficiaries Ticket to Work and other program information to help them understand how work affects their Social Security benefits.
current-pay status. Status of a beneficiary or recipient who is paid a benefit for a given month, with or without deductions, provided the deductions add to less than a full month's benefit.
disability. The inability to engage in SGA by reason of any medically determinable physical or mental impairment that can be expected to result in death or to last for a continuous period of not less than 12 months.
disabled adult child. A disabled person aged 18 or older—a son, daughter, or eligible grandchild of a retired, deceased, or disabled worker—whose disability began before age 22.
disabled widow(er). A widow(er) or surviving divorced widow(er) of a worker fully insured at the time of death, if he or she is aged 50–59 and has been disabled throughout a waiting period of 5 consecutive calendar months that began no later than 7 years after the month in which the worker died or after the end of his or her entitlement to benefits as a widowed mother or father. A surviving divorced widow(er)'s marriage to a worker must have lasted 10 years before the divorce became final. Benefits payable after December 1983 are continued for disabled widow(er)s and surviving divorced widow(er)s who remarry after the age of first eligibility for benefits.
disabled worker. A person who has earnings creditable for Social Security purposes on the basis of services for wages in covered employment or on the basis of income from covered self-employment.
earned income exclusion. The first $65 (up to a maximum of $85 if the individual has no income other than earnings) of any monthly earned income plus one-half of remaining earnings are excluded for SSI benefit computation purposes.
employment network—EN. Private or public organizations that enter into an agreement with SSA to provide services such as career counseling and assistance with job placement to disability-program beneficiaries and recipients.
expedited reinstatement. A provision of the Ticket to Work and Work Incentives Improvement Act. Effective January 1, 2001, if a person's Social Security or SSI disability benefits have ended because of earnings from work and he or she becomes unable to work again within 60 months because of his or her impairment, he or she can request reinstatement of benefits, including Medicare and Medicaid, without filing a new application.
extended period of Medicare eligibility—EPE. A period of 36 consecutive months that follows a trial work period (TWP). During the EPE, DI beneficiaries may still receive benefits depending on how much they work and earn. SSA can pay beneficiaries disability benefits during their EPE if:
- their condition is still disabling, and
- their work is not substantial.
Benefits end if the beneficiary engages in substantial work after the end of the EPE. See also trial work period and substantial gainful activity.
full retirement age—FRA. The age at which a person becomes entitled to unreduced retirement benefits.
hourly reservation wage. The lowest hourly wage for which the survey respondent would be willing to work.
impairment-related or blind work expenses. The costs of items or services that a disabled or blind person needs to work. The expenses, when paid by the beneficiary or recipient, are deducted from his or her gross earnings when determining if the work is considered substantial gainful activity.
Medicaid. A federal-state program that provides medical assistance for certain individuals and families with low incomes and limited resources.
Medicare. A federal health insurance program for most persons aged 65 or older and for certain other individuals with disabilities. People who qualify because of disability are eligible for Medicare after the first 24 months of DI benefit entitlement. Medicare coverage consists of one or more of the following:
- Hospital Insurance (Part A),
- Supplementary Medical Insurance (Part B),
- Prescription drug coverage (Part D).
Partnership Plus. A TTW program in which SVRAs partner with ENs to provide services to a beneficiary or recipient after SVRA services end.
plan to achieve self-support—PASS. A formal plan, requiring SSA approval, for attaining a specific work goal. With a PASS, an SSI recipient may set aside income and resources as needed to pay for training, equipment, or other employment-supporting goods or services. SSA does not count the income and resources set aside under a PASS when deciding SSI eligibility and payment amount.
positive countable earnings. The amount of earned income used for the SSI payment calculation. It is generally equal to half of actual earned income minus deductions and exclusions.
property essential for self support. Property used for a business or personal property used for work as an employee that is excluded from resources when determining continuing eligibility for SSI.
proxy. An individual who answers survey questions on behalf of a sample member whose disabilities prevent him or her from responding.
sheltered employment. A program that provides employment with subsidized wages (or special wages that would not be available in a regular job) for people with disabilities.
Social Security Disability Insurance—DI. The program that provides monthly benefits to disabled or blind persons who are insured by workers' payroll-tax contributions to the Social Security trust fund. The contributions are based on the worker's earnings. A worker's dependents may also be eligible for benefits based on the worker's earnings record.
state vocational rehabilitation agency—SVRA. Every state has a vocational rehabilitation agency to help individuals with disabilities meet their employment goals. Vocational rehabilitation agencies assist individuals with disabilities to prepare for, obtain, maintain, or regain employment. SVRAs serve SSA program beneficiaries and recipients under the traditional reimbursement system or as an EN under the TTW program.
student earned income exclusion. A provision that allows SSI recipients who are under age 22, regularly attending school, and receiving earned income to exclude some or all of their earned income from their countable income.
substantial gainful activity—SGA. A measure of work activity with which SSA evaluates the capacity for work of individuals applying for or receiving DI disabled-worker benefits or those applying for SSI payments because of a disability (other than blindness). SSA generally uses an earnings threshold to determine whether an applicant's or beneficiary's work is substantial, and whether that individual is considered disabled under the law.
Supplemental Security Income—SSI. A federal program for low-income aged, blind, and disabled individuals who meet income and resource requirements. Beginning in 1974, SSI replaced the former federal and state programs of Old-Age Assistance, Aid to the Blind, and Aid to the Permanently and Totally Disabled. SSI is funded by general tax revenues, not Social Security taxes.
suspension because of work. Benefit non-payment status because of suspension for work.
termination because of work. Benefit non-payment status because of termination for work. A beneficiary or recipient is presumed terminated for work if he or she had benefits terminated in an earlier month that were never reinstated, and is alive and has not attained FRA.
Ticket to Work—TTW. A program that helps DI and SSI beneficiaries return to work through employment services.
trial work period—TWP. A 9-month period during which monthly benefits continue for DI beneficiaries who are still disabled but return to work. If the disability ends after completion of the trial work period, benefits continue for an additional 3 months, and then entitlement is terminated. A disabled beneficiary would exhaust the trial work period only if substantial work was performed in any 9 months within a period of 60 consecutive months. For a discussion of procedures when the disabling condition continues, see extended period of Medicare eligibility.
weighted statistics. Statistics that have been adjusted using the sampling weights. Sampling weights are computed from the inverse selection probability that incorporates the stages of sampling in the survey, adjusted for nonresponse. The weighted statistics represent the national population of beneficiaries.
work-oriented. A category of beneficiaries who have indicated that their personal goals include getting a job, moving up in a job, or learning new job skills or who saw themselves working for pay in the next 2 years or in the next 5 years.
Abbreviations
- CPI-W
- Consumer Price Index for Urban Wage
and Clerical Workers - CPS
- Current Population Survey
- DAF
- Disability Analysis File
- DI
- Disability Insurance
- EN
- employment network
- FRA
- full retirement age
- IRS
- Internal Revenue Service
- MEF
- Master Earnings File
- NBS
- National Beneficiary Survey
- SGA
- substantial gainful activity
- SSA
- Social Security Administration
- SSI
- Supplemental Security Income
- SVRA
- state vocational rehabilitation agency
- TTW
- Ticket to Work
- TWP
- trial work period