Testimony of Stephen C. Goss,
Chief Actuary, Social Security Administration
Before the Committee on the Budget, U.S. House of Representatives
February 28, 2012
Chairman Ryan, Ranking Member Van Hollen, members of the committee: thank you for the opportunity to discuss with you today how we can strengthen the health and retirement systems that provide security for the population of the United States. In July of last year, we talked about the “Fiscal Facts” specifically for Social Security and Medicare. However, today’s topic is broader than just those two programs. If we are to succeed in providing a secure future for retirees, and for all Americans, we need to: (1) understand the challenges we are facing; (2) decide on what we want for future retirees; (3) assess how we are doing so far; and (4) determine what changes we need to make.
(1) Two Fundamental Challenges We Face as a Nation
The near term fiscal challenges of the Federal budget must be considered in the context of the two longer-term challenges we face as a nation. First, our population is aging due largely to the drop in birth rates that began over 40 years ago and continues today. Second, the world has shrunk and we now compete for jobs directly with other populations around the globe.
Our Aging Population
Prior to 1970, women in the US had about three children who survived to adulthood. Since
1970, our birth rate has dropped to a new level of two children per woman.
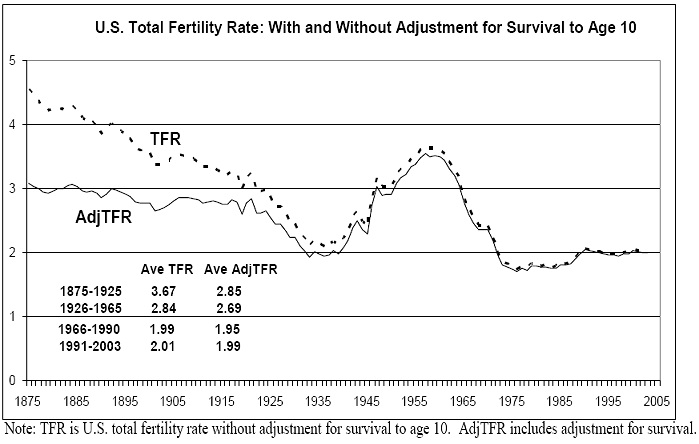
This decline in birth rate affects the age composition of the population. All else equal, we will have one-third fewer working age people for every elder in the future. This shift started around 2010 and will be complete around 2030. Even with projected increases in employment of our older population, the number of workers for each Social Security and Medicare beneficiary will drop from three to two over the next 20 years.
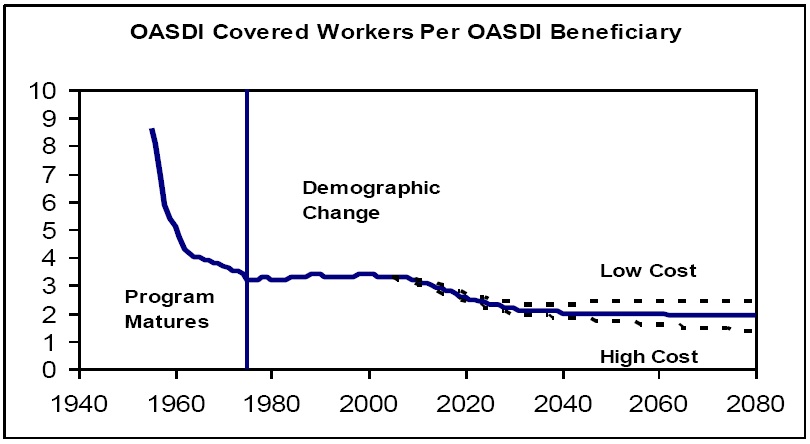
Virtually all other economically developed countries are facing a similar or worse aging of the population. Therefore, we are not alone in this challenge. What this aging means, however, is that retirees will be a larger portion of the population, and so will consume a larger portion of the economic output of our economy. Whether through government programs or other means, a greater share of GDP will go to elders for food, shelter, and services, including health services, if we are to maintain the same relative standard of living in retirement in the future as in the past.
Shrinking World and Competitiveness
Capital and technology, and products and services, flow across borders more readily than ever
before. Yet we support our population, and particularly our retirees, mainly from the earnings of
workers within our borders.
Our projections for Social Security and Medicare assume real increases in output per hour worked of 1.7 percent per year, and real increases in average earnings of 1.2 percent per year in the future. OMB and CBO make similar, if not more optimistic, assumptions. If we are to achieve these gains, we need a highly skilled, highly educated workforce in the future and must invest accordingly.
(2) Retirement Income and Health Services We Want
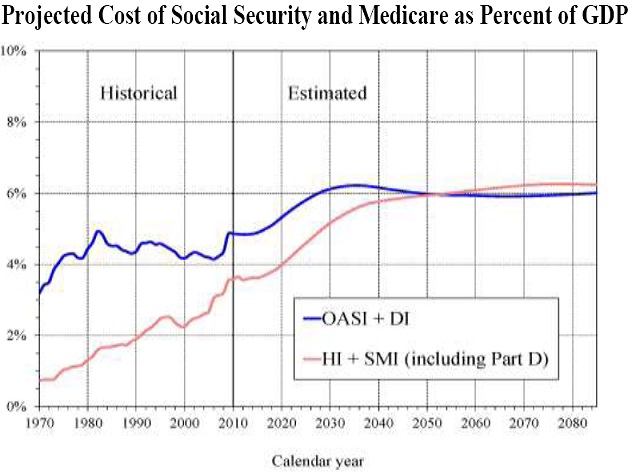
Retirement income provides for the most basic needs of food and shelter. These are essential. We have become sufficiently productive to afford many other things, such as the most extensive health care system in the world. Maintaining this level of retirement security in the future will require a greater share of gross domestic product (GDP) than in the past, simply because of the aging of the population. Social Security and Medicare are only two of many components of this security, but the projected trend in their cost parallels the trend in cost for all other sources of retirement security.
Over the next 20 to 30 years, the Social Security and Medicare Boards of Trustees project that the cost of Social Security will increase by about one-third, from 4.5 percent of GDP to 6 percent of GDP, and that the cost of Medicare will nearly double from 3.5 percent of GDP to 6 percent of GDP. If we desire to maintain the same relative retirement income and health care, these increased costs as a share of GDP will have to be met. The alternative is reduced relative retirement income and health care.
Social Security benefits were never intended to provide all we need in retirement. Employersponsored pensions and personal savings are the other two legs of the “three-legged stool.” Pensions and savings have not kept up with retirement needs. Roughly one-half of workers retire with pension accumulations; however, these pensions have increasingly been “defined contribution” plans, where most retirees take lump-sum distributions instead of annuities. Annuities, like Social Security benefits, provide guaranteed monthly income for the rest of retirees’ lives. Even many traditional “defined benefit” plans have begun offering lump-sum options.
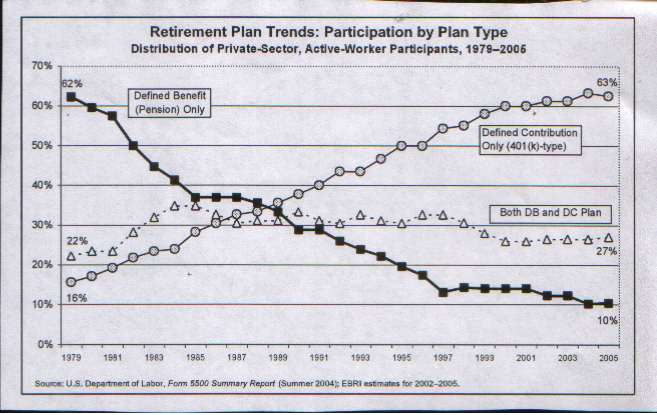
Efforts to encourage and promote purchase of annuities with private savings and pension accumulations could help. However, we have succeeded so well in emphasizing the importance of accumulating a “nest egg,” few are willing to part with their accumulation to purchase an annuity. The “floor of protection” provided by Social Security is more needed than ever.
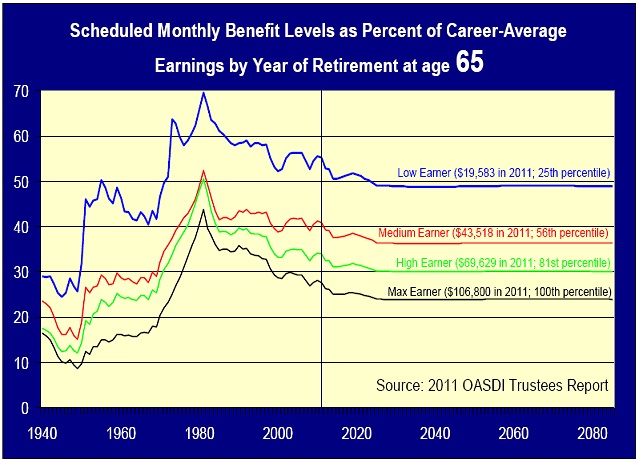
In this context, Social Security benefit levels require careful consideration. Even assuming retirement at age 65, Social Security monthly benefits will replace less than 50 percent of careeraverage earnings for those who made about $20,000 per year, and only about 30 percent for those who made $70,000 per year.
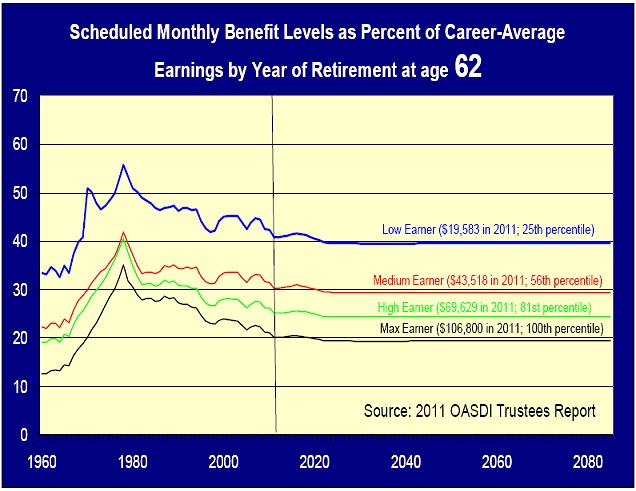
For those retiring at 62, as over half do, the percent of career-average earnings is even lower, at less than 40 percent for the $20,000 earner, and less than 25 percent for the $70,000 earner.
(3) How Are We Doing So Far?
Scheduled payroll tax and benefit taxation revenue for Social Security amount to about 4.5 percent of GDP. However, the cost of scheduled benefits will rise to 6 percent of GDP over the next 20 years. This growing shortfall will, over the next 25 years, gradually use up the $2.7 trillion in reserves now held in the Social Security Trust Funds.
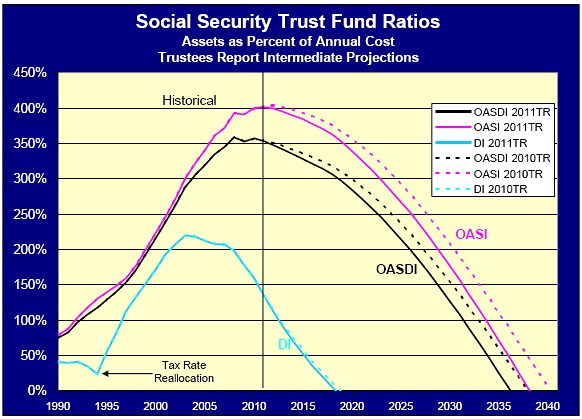
If no action is taken, the Disability Insurance (DI) Trust Fund reserves will be depleted soon. For the 2011 Trustees Report issued last May, we projected DI reserves would be exhausted early in 2018. With the surge in oil prices due to Middle East issues since last spring, the COLA for December 2011 was 3.6 percent, almost 3 percentage points higher than projected. As a result, the DI reserves will more likely be depleted early in 2017 or late in 2016. The immediate DI problem can be fixed with a tax-rate reallocation between the OASI and DI programs, as was done in 1994. However, exhaustion of combined OASDI Trust Fund reserves will still face us by 2036, or sooner. If we do not act, benefit levels will be reduced automatically by about 25 percent by 2036.
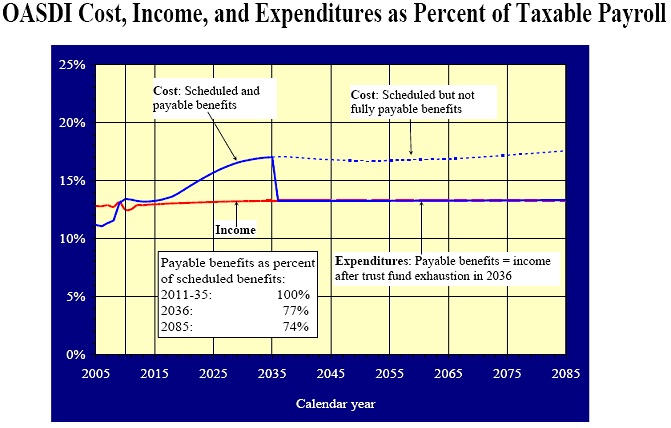
In the very near term, the dollar level of combined OASDI Trust Fund reserves is still rising. Total income, including interest, is projected to exceed program cost through 2020.
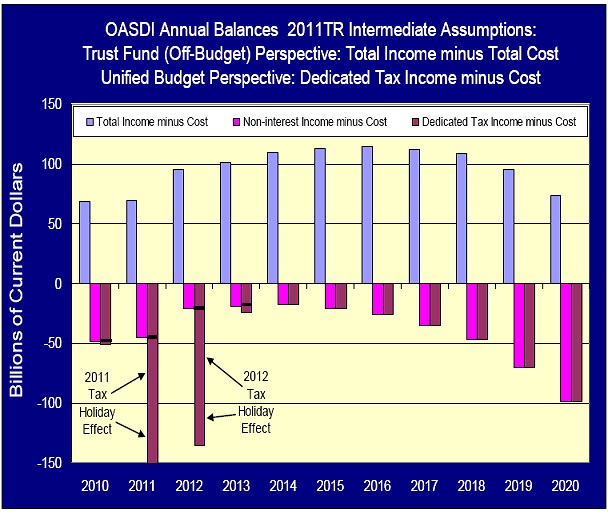
However, cost began to exceed non-interest income in 2010 due to the economic downturn and is projected to remain higher than non-interest income in the future.
In addition, payroll tax rates have been used as a mechanism for fiscal stimulus with the HIRE Act for 2010, and with 2-percent payroll-tax holidays for 2011 and 2012. None of these temporary stimulus measures has had a negative effect on the actuarial status of Social Security, because the General Fund of the Treasury has reimbursed the Trust Funds for every dollar of reduced payroll tax. The temporary payroll-tax rate reductions have, however, added to unified budget deficits, as a part of the fiscal stimulus measures to promote more consumer demand and economic growth.
(4) What Changes Do We Need to Make?
With Social Security scheduled benefits replacing less than half of earnings for workers earning $20,000, and replacing even less for higher earners, and the prospect of even these levels being cut by 25 percent automatically by 2036, we need to consider the following options:
(a) Provide added revenue to maintain Social Security benefits at currently scheduled levels; (b) Provide even more revenue to increase scheduled benefits;
(c) Provide universal alternative means for guaranteed lifetime retirement income to
supplement Social Security;
(d) Promote purchase of life annuities with a larger share of savings and pension
accumulations at retirement; or
(e) All of the above.
Several proposals have recommended substantial increases in revenue to help pay for scheduled Social Security benefits.
(i) Both the Simpson-Bowles Commission and the Rivlin-Domenici Plan recommended increasing the maximum level of annual earnings subject to payroll tax by enough to eliminate about 25 percent of the long-range actuarial deficit.
(ii) Representative Deutch proposed to eliminate the limit on earnings taxed, as was done for Medicare, in order to completely eliminate the 75-year actuarial deficit.
(iii) Chairman Ryan and the Rivlin-Domenici Plan proposed to eliminate the exclusion of premiums for employer-sponsored group health plans from earnings subject to payroll tax. This change would eliminate about 50 percent of the long-range actuarial deficit.
Several proposals would increase the level of benefits for at least some beneficiaries.
(i) Both the Simpson-Bowles Commission and the Rivlin-Domenici Plan recommended enhancements to the current minimum benefit provisions of Social Security (ii) Representative Deutch proposed using the Consumer Price Index designed for the elderly to determine COLAs, rather than the index designed for urban workers. This change would provide increased benefit adequacy at the oldest ages where poverty is greater. (Census 2009 Poverty: 8% for 65-74, 10% for 75 and over.)
Several proposals would provide workers with an option to redirect a portion of their payroll tax to personal accounts in return for lower benefits from Social Security.
(i) Chairman Ryan has recommended a plan for a voluntary personal account with a minimum guaranteed rate of return.
(ii) Representative Landry has proposed that workers have an option to reduce their payroll tax rate by 2 percent for any year in return for an increase in their normal retirement age by 1 month.
Several proposals would alter the structure of Social Security benefits in order to encourage workers to work longer and start benefits later.
(i) Representatives Kolbe and Stenholm, and others, have recommended increasing the size of reductions for taking benefits early, thus encouraging later benefit claiming.
(ii) The Simpson-Bowles Commission recommended an increase in the earliest age at which benefits could be started in order to keep monthly benefit levels as high as possible, even if payable for fewer years. This proposal also offered a waiver of the increased retirement age for low-paid, long career workers.
Many proposals have recommended targeted reductions in scheduled benefits, particularly for higher earners, so that currently scheduled revenue will be able to pay for more of the benefits now scheduled for lower earners.
Finally, we could promote the purchase of life annuities or “longevity insurance” with personal savings and pension accumulations. For example, a sum of $100,000 at 65 could provide inflation-indexed retirement income in several different ways, including:
(i) Without purchasing an annuity, spend $324 per month to make sure the $100,000 will last until age 110.
(ii) Buy a life annuity at 65 paying $544 per month for life.
(iii) Buy a 20-year deferred annuity and spend the remainder of the $100,000 until age 85, for $475 per month.
Conclusion
We are at the beginning of a substantial and permanent shift in the age distribution of our population. This shift was caused by the drop in birth rates from the long-time average level of about three children per woman through 1965, to just two children per woman since 1975. By 2040, there will be only two workers for every OASDI beneficiary, down from three workers per beneficiary throughout the period 1975 through 2008. As a result, the cost of Social Security will shift from about 4.5 percent of GDP to a stable level of 6 percent of GDP by 2040. Currently scheduled tax revenue will remain at about 4.5 percent of GDP. Making Social Security solvency sustainable will therefore require a choice to:
Increase revenue by 33 percent after 2035,
Reduce benefits by 25 percent after 2035, or
Enact some combination of these changes
In the absence of legislation, the combined OASDI Trust Fund reserves are projected to become exhausted in 2036, with only 75 percent of presently scheduled benefits payable thereafter through 2085.
In addition, we are facing a global challenge for the best high-paying jobs. It is critical that we invest in the workers of the future to assure that they will have the highest possible level of skill, training, and education. Without this investment, we will not achieve the level of real productivity and earnings growth needed to pay for retirement income and health costs in the future.
Members of Congress and various Commissions have laid out a wide range of possible approaches for financing and altering currently scheduled Social Security benefits to meet the challenges of the future. However, Social Security cannot achieve these goals alone. We also need personal savings and private pensions to contribute more to lifetime guaranteed retirement income.
Chairman Ryan, Ranking Member Van Hollen, and members of the committee, all in my office look forward to continued work with you and all members of the Congress in the development of legislation that will restore long-range sustainable solvency for the Social Security Trust Funds and strengthen the retirement and health security of our population.